Datalogger
General Description
The data logger tool is used to :
Display data as one of the following options :
Signal
Text
Seven Segment Display
Save data to file
Import data from file
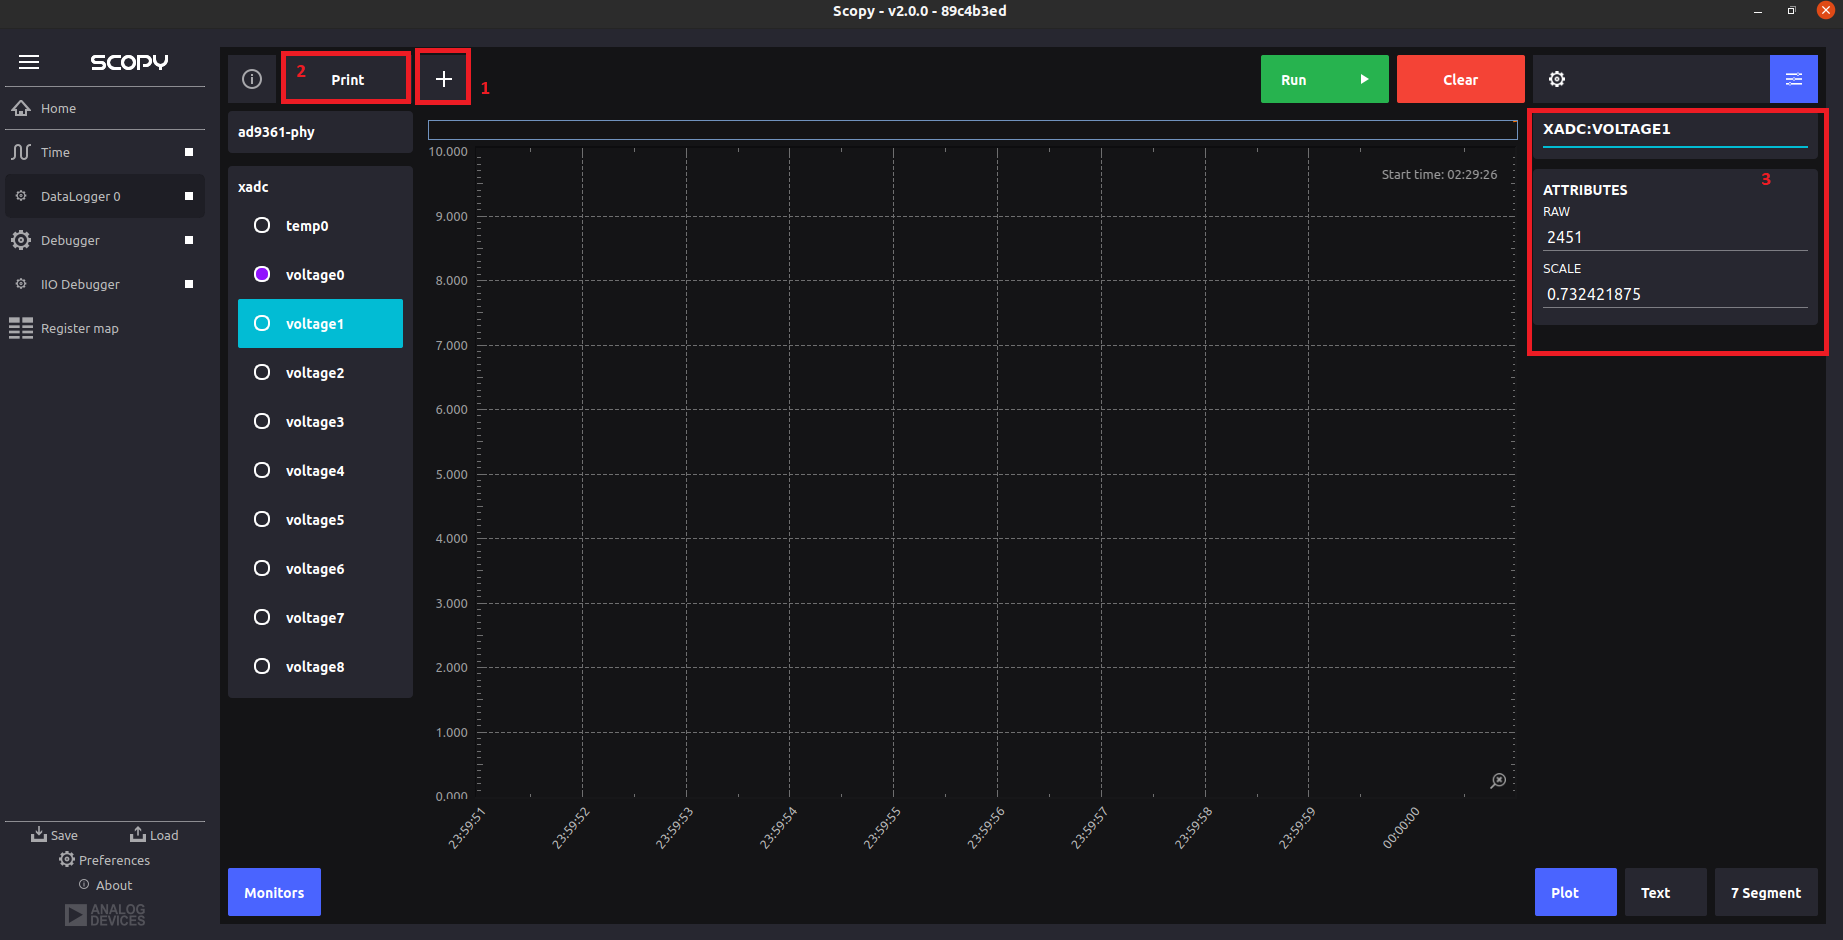
Pressing the “+” (1) button will generate a new tool
Print button (2) will allow user to save current visible plot to a .pdf
format allowing user to print it
Data on each channel attributes is shown in the right menu (3) when clicking
on a channel.
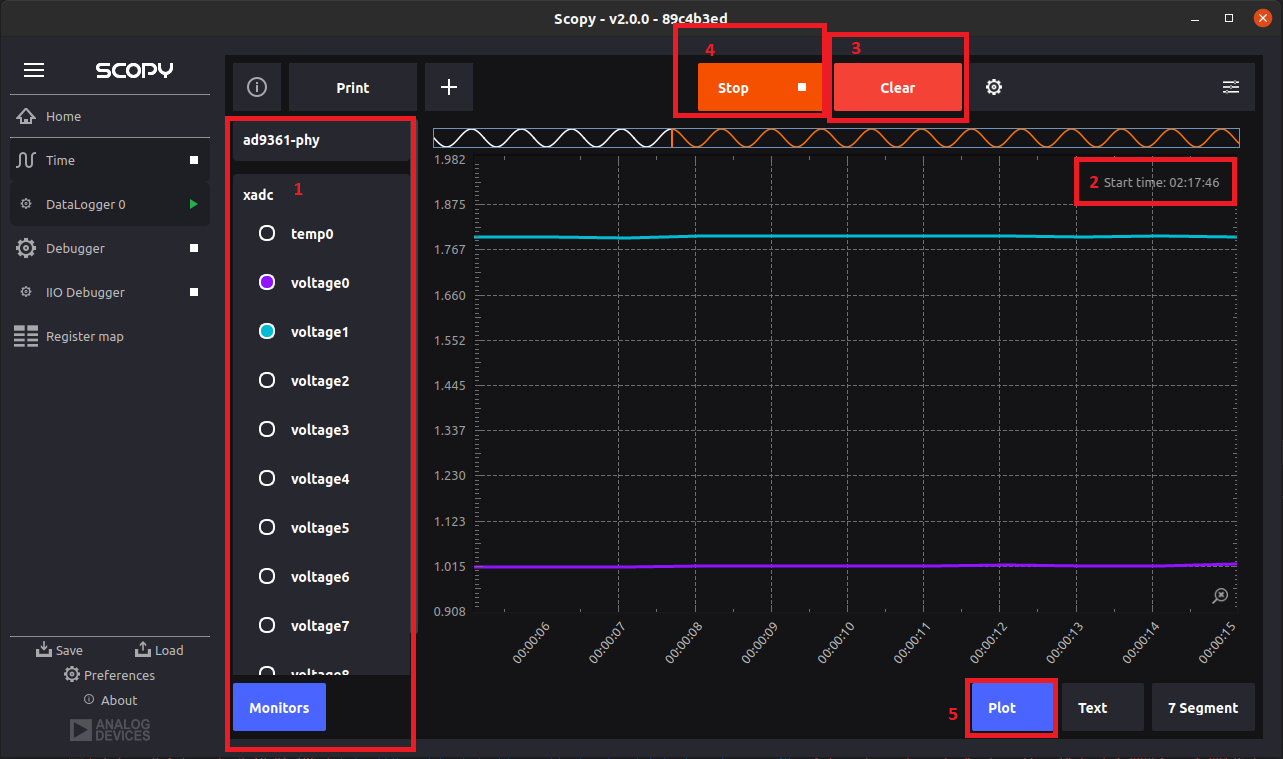
Display Signals
Using the left side menu (1) user can select from the available device channels that will be displayed on the plot. The data is plotted in time based on the starting time (2), the starting time reflects when the tool started collecting data and will reset on user pressing “Clear” (3). The data that will be displayed is collected from the device on pressing “Run/Stop” (4) button. The data collected will be removed on pressing “Clear” this will also reset the starting time. To use this option click “Plot” (5) button on the bottom right
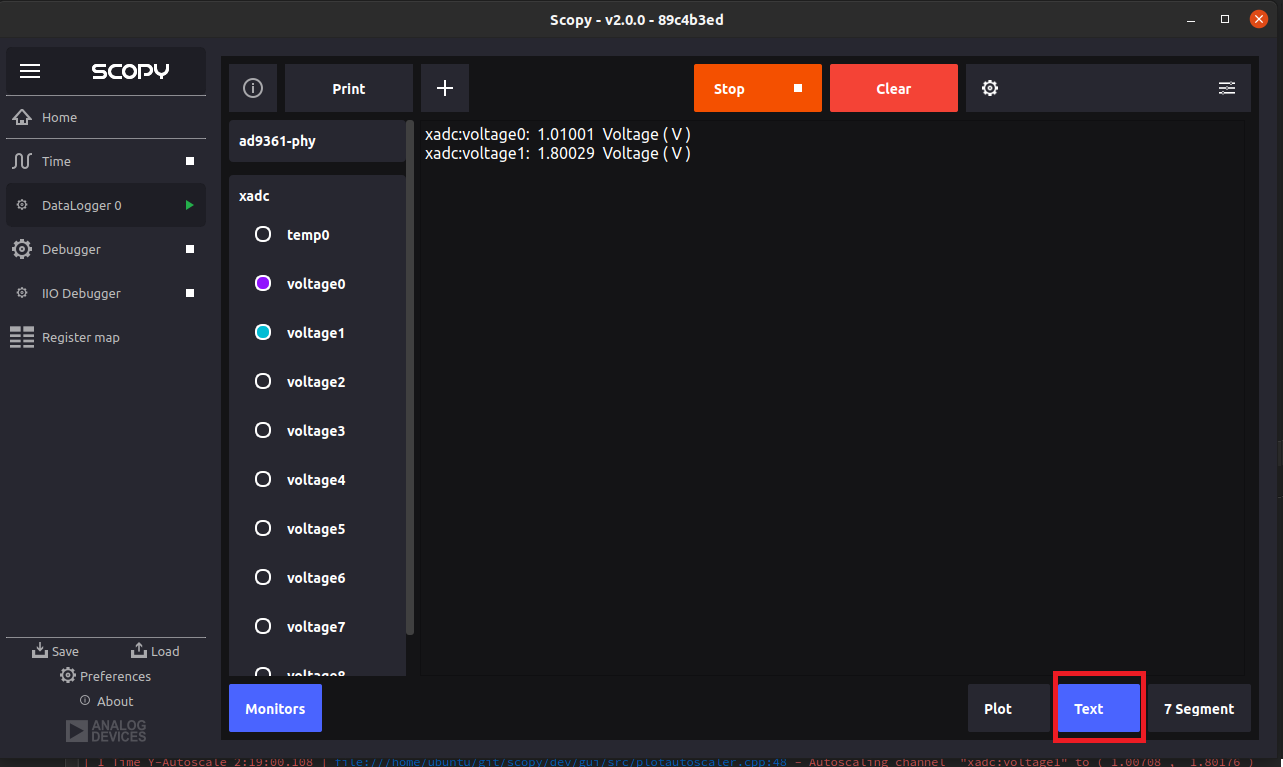
Display Text
Using the left side menu user can select from the available devices, for the selected device channels last read value and the unit of measurement will be displayed in text format
To use this option click “Text” button on the bottom right
Display Seven Segment
Using the left side menu user can select from the available devices, for the selected device channels last read value, minimum and maximum recorded values and the unit of measurement will be displayed in seven segment display format
To use this option click “7 Segment” button on the bottom right
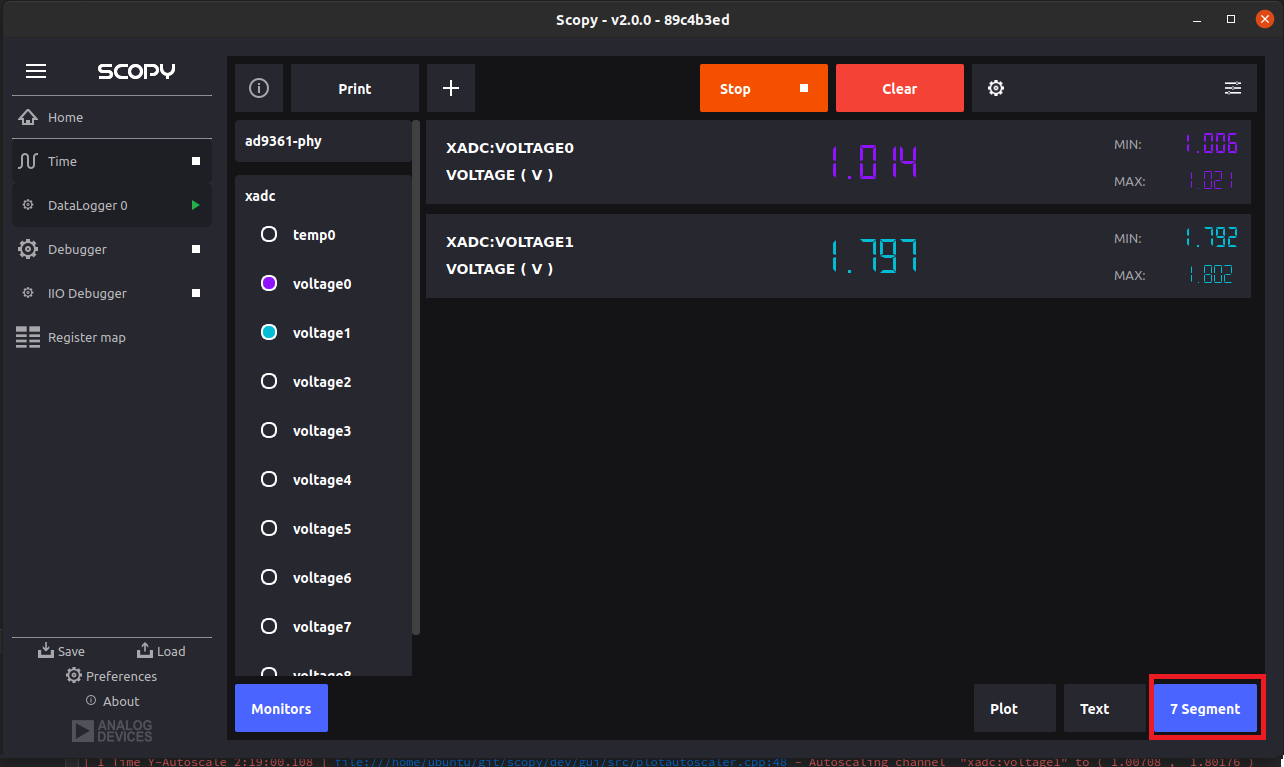
Channel Attributes
When you click on a channel in the left menu, the channel attributes panel opens on the right side. This panel provides several customization options for each individual channel:
Custom Display Names
You can customize how channels appear in the interface by changing their display names:
Click on any channel in the left menu to open its attributes panel
The channel name appears in the header at the top of the attributes panel
Click on the name field to edit it directly
The new display name will be used throughout the interface (plots, seven segment displays, etc.)
Unit of Measurement Customization
The “Unit Of Measurement” section allows you to override the default units for any channel:
In the channel attributes panel, find the “Unit Of Measurement” section
Name: Override the full unit name (e.g., “Voltage”, “Temperature”, “Pressure”)
Symbol: Override the unit symbol (e.g., “V”, “°C”, “Pa”)
These custom units will be displayed in all views (text, seven segment, and plot legends)
Other Channel Settings
The attributes panel also includes:
Attributes: Device-specific channel configuration options
Scaling: Raw values, device scaling, or custom scale override
Plot Assignment: Assign channels to different plots (experimental feature)
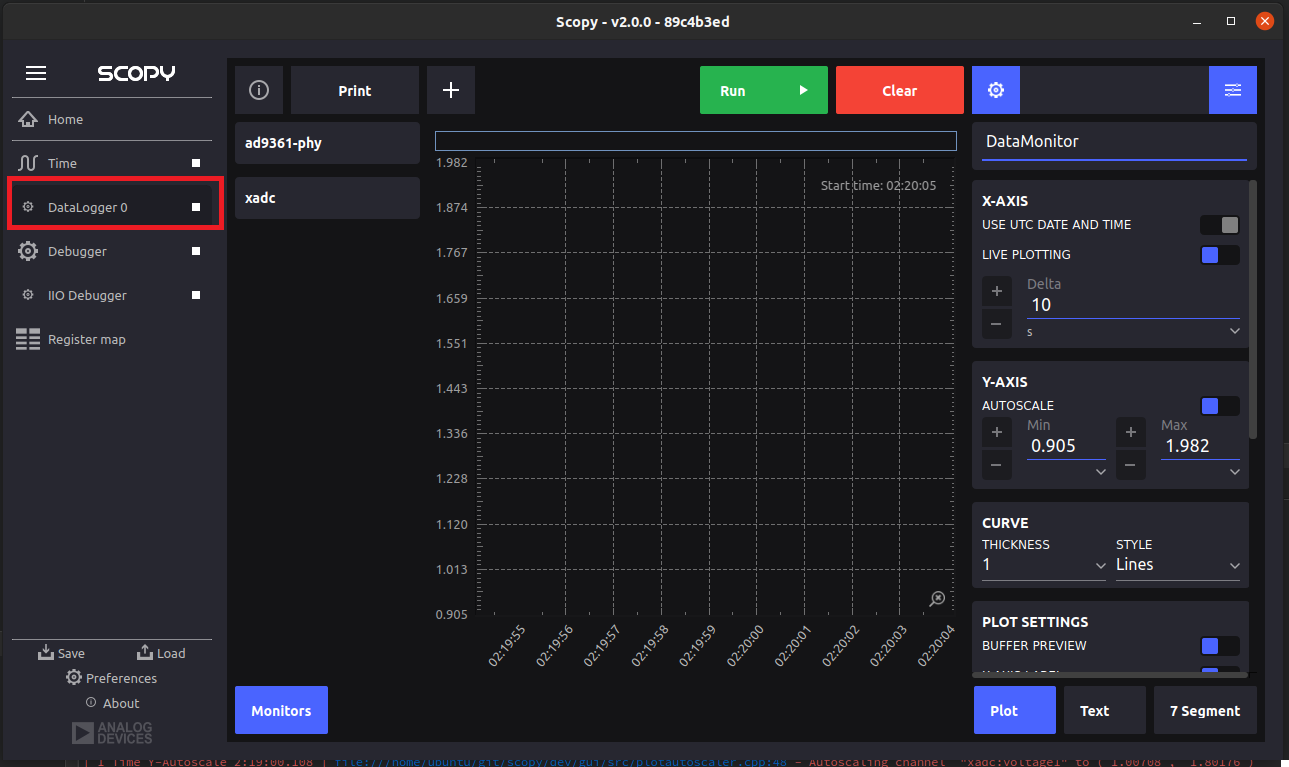
Settings
The gear button in the top right corner of the plugin will open the settings allowing user to alter configurations as follow
Changing the title in settings from “DataMonitor” will reflect in the tool name
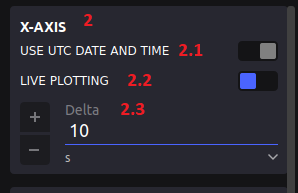
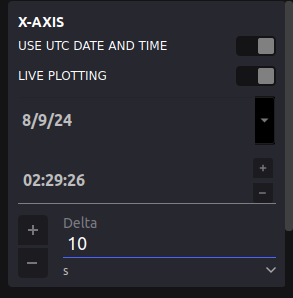
X-AXIS : settings for x axis
2.1. Toggle between displaying real time or delta values (Use UTC date and time) . Real time values are based on the system time, delta values consider starting point as 0 and represents the amount of time passed since then.
2.2. Toggle “LIVE PLOTTING”
when enabled will update the plot to the current time
for each read
when disabled will allow user to pick a date and a time to go to on the plot
2.3. Delta represents the interval displayed on the plot
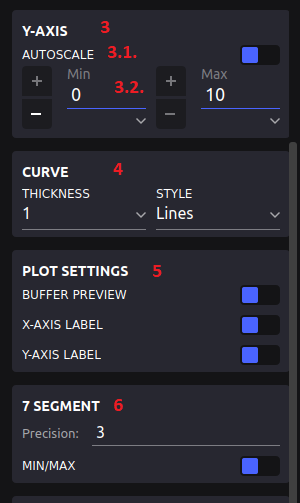
Y-AXIS: settings for y axis
3.1. Autoscale option changes the minimum and maximum of Y-Axis to fit all values recorded
3.2. Min and Max values will update the minimum respectively the maximum values of Y-Axis, this only works if Autoscale is off
Curve settings affect all curves on the plot user can set the curves thickness and style
Plot settins are used to show/hide plot items
Settings for seven segment section allow user to set precision of display values and toggle on/off the minimum and maximum values
Data logging section is used for saving and importing data from and to a specified CSV file like the one bellow
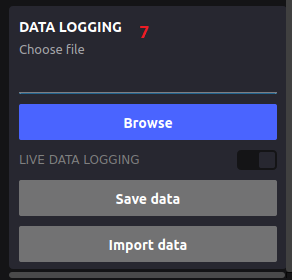
Save data
To save data to file there are two options
Toggle “Live data logging” on this will save to file data on each read for all enabled channels
Pressing “Save data” will override the selected CSV file with all the recorded values of the enabled channels
Import data
On importing data a special menu is added containing the channels from file. Each channel contains the data from the CSV file from it’s column, no extra data will be added to those channels when tool is recording. By pressing the “x” button all imported data is removed. Importing data multiple times from same CSV file will override current imported data Importing data from different CSV files will create new menus like the one bellow for each file
Tutorial
A tutorial will automatically start first time the tool is open. It can be restarted from tool Preferences.
Preferences
This documentation describes the options available in the Preferences page for the Data Logger Plugin.
Maximum Channel Data Storage
Allows the user to set the maximum data storage for each monitor.
Default Value: 10Mb
Read Interval
Allows the user to set the interval at which data is read.
Default Value: 1 second
X-Axis Date Time Format
Allows the user to set the date time format for the X Axis.
Default Value: hh:mm:ss
Experimental Features
The Data Logger Plugin also includes several experimental features that may be subject to change in future releases. These features are provided for early access and feedback:
Multiple Plot Assignment
Channels can be assigned to different plots using the channel attributes menu.
This allows for more flexible data visualization and organization.
The plot assignment combobox will update automatically if plots are added,
removed, or renamed.
Dynamic Plot Management
Users can add or remove plots dynamically. Each plot can have its own settings
and channels assigned.
The plot selector and settings menus will update in real time to reflect changes
in plot configuration.
Live Plot Name Synchronization
When a plot is renamed, all relevant menus and selectors update instantly to
reflect the new name, ensuring a consistent user experience.
These experimental features are under active development. Feedback is welcome and can help shape their future improvements.