AD74413R
Overview
The AD74413R tool is only available in the runtime mode, along with the MAX14906 tool and the Faults tool. It represents the main interface for the AD74413R chip and it dynamically shows all the channels configured for that device. For each channel we can read/write data through this interface using the libiio library.
The possible functions of an AD74413R channel are as follows: high_z, voltage_out, current_out, voltage_in, current_in_ext, current_in_loop, resistance, digital_input, digital_input_loop, current_in_ext_hart and current_in_loop_hart. For each selected function, one or two channels will be generated within the device context, which will be used for communication with the physical channel.
Only the buffered input channel data can be displayed on the plot, and in the case where a function generates both an input and an output channel, the advanced menu will be associated with the output channel or both channels. The channels generated according to the selected function are as follow:
Function |
Input channel |
Output channel |
|---|---|---|
high_z |
Voltage In |
|
voltage_out |
Current In |
Voltage Out |
current_out |
Voltage In |
Current Out |
voltage_in |
Voltage In |
|
current_in_ext |
Current In |
|
current_in_loop |
Current In |
Current Out |
resistance |
Resistance |
|
digital_input |
Voltage In |
|
digital_input_loop |
Voltage In |
Current Out |
current_in_ext_hart |
Current In |
|
current_in_loop_hart |
Current In |
Current Out |
Instrument Layout
Run button
The run button will start an acquisition task that will collect data from the active input channels.
The acquisition task will stop upon user intervention.
The data acquisition frequency is set by the user through the settings menu.
All the data will be displayed on the plot.
Single Button
The single button will start a single capture acquisition for all the active input channels. The acquisition task will stop once all the data is acquired and displayed on the plot.
Settings Button
Show/Collapse the menu of general settings.
Advanced Menu Button
Show/Collapse the advanced menu of the channels. Each channel is associated with an advanced menu through which various attributes can be modified.
Menu Area
Here is displayed the menu of general settings, as well as the advanced menu for each channel.
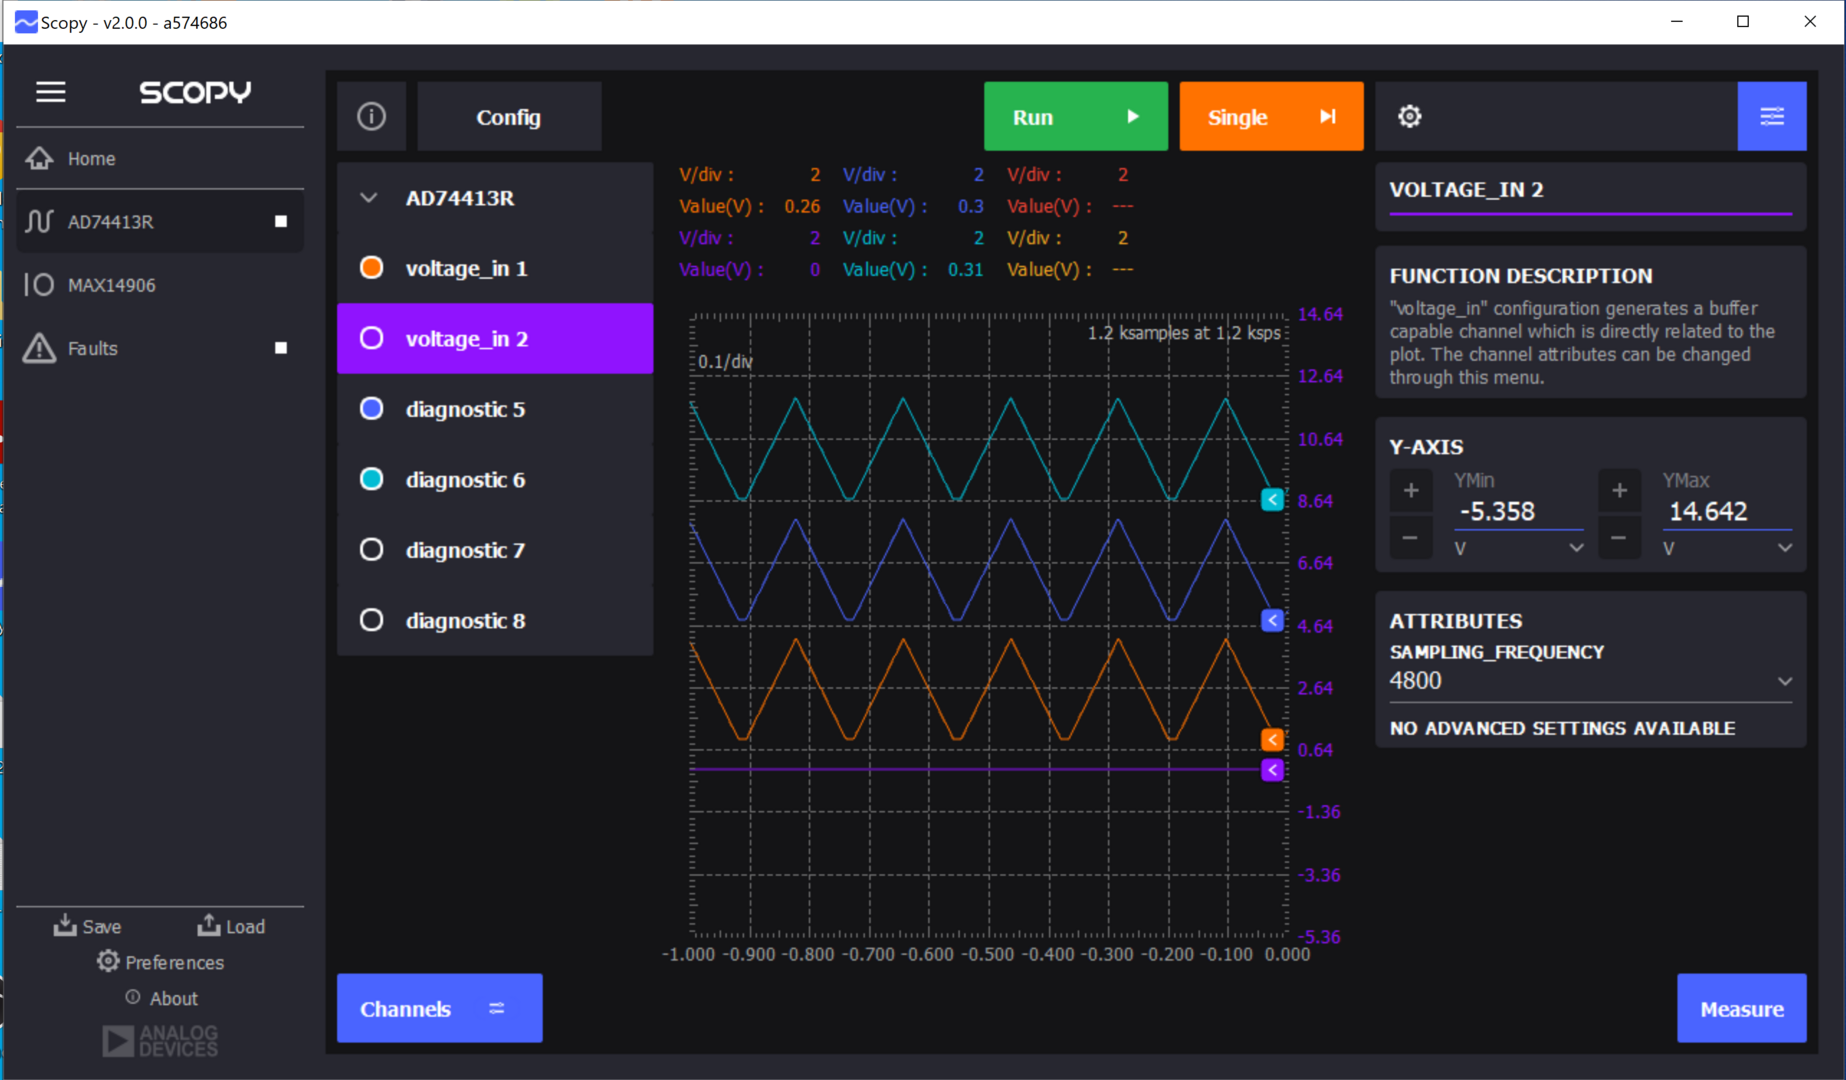
Channels list
The functions assigned to each channel are displayed here. The functions with indices from 1 to 4 are correlated with the physical channels on the board. 5 to 8 indices are correlated with the diagnostic channels. When a channel is selected, it is highlighted.
Plot
Display data from all the active channels. Display the number of units per vertical division. Display the instant value for all channels.
Info button
Print button
Save the plot with the data and channels into a PDF file.
Config button
When pressing the config button, Scopy will switch the SWIOT1L mode to config. The device will briefly disconnect and then reconnect. After that it will automatically display the Config Instrument.
Channel item layout
Enable button
Enable/Disable a channel. If a channel is disabled, it will no longer be displayed on the plot and data will not be acquired for it.
Channel function name
Menu button
Show/Collapse the advanced menu of the selected channel.
Plot Layout
Drawing area for the curves
Each input channel has a corresponding curve on the plot.
Curves handle area
Each curve is associated with a handle through which we can position the curves at different values on the Y-axis.
Acquisition status
Display the number of acquired samples and the rate at which these samples are acquired. The samples per second (SPS) is calculated based in the frequency and the number of enabled channels.
If you hover the info button you will find all the necessary information.
General settings layout
Acquisition settings section
Sampling frequency represents the frequency at which data is acquired. It is a property shared by all the available channels. Available options: 10, 20, 1200, 4800. The plot timespan can be set between 100ms and 10s.
Export section
It provides the possibility to export data corresponding to the activated input channels into a CSV file. You can choose the channels for which data will be exported.
Arrow button
The menu can be detached and reattached by pressing the arrow button in the top right corner.
Tutorial
A tutorial will automatically start first time the tool is open. It can be restarted from tool Preferences.