Oscilloscope
The oscilloscope instrument consists of a central signal plot and a control panel with the settings for the different instrument options. The plot displays the waveforms that are captured on the available scope channels.
To switch to this instrument click on the Oscilloscope button from the left menu.
Note
A Calibration feature automatically starts for the Oscilloscope instrument when Scopy connects to an M2k device.
Video guide:
General

The control panel slides in and out from the right side of the screen and can be opened by pressing the button of any element from the right side of the bottom menu bar. The elements can be:
Channel Settings
Cursors
Measure
Trigger
The channels list is available on the left side of the bottom menu bar. A channel can be activated/deactivated by pressing the radio button on the left of the channel name. The channel settings for each enabled channel can be opened using the button located on the right side of the channel name.

When pressing on the channel, the name of the channel is selected. Only one channel can be selected at a time. The Cursors and Measurements settings will all apply (if enabled by pressing their corresponding radio buttons) to the selected channel.
Channel settings:
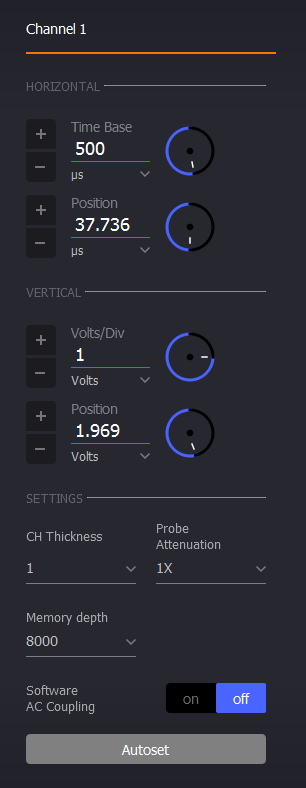
Time Base: – It can be changed either by pressing the +/- buttons or by writing a value in the edit box. Pressing the center of the range circle toggles between fine/coarse modes. Dropdown menu is available for selecting the proper measurement unit.
Horizontal Position: – It can be changed either by pressing the +/- buttons or by writing a value in the edit box. Pressing the center of the range circle toggles between fine/coarse modes. Dropdown menu is available for selecting the proper measurement unit.
Volts/Div: – It can be changed either by pressing the +/- buttons or by writing a value in the edit box. Pressing the center of the range circle toggles between fine/coarse modes. Dropdown menu is available for selecting the proper measurement unit.
Vertical Position: – It can be changed either by pressing the +/- buttons or by writing a value in the edit box / drag the waveform on the screen vertically using the offset handles on the left of the plot. Pressing the center of the range circle toggles between fine/coarse modes. Dropdown menu is available for selecting the proper measurement unit.
CH Thickness: Changes the line thickness of the selected channel waveform that is drawn on the plot canvas.
Probe Attenuation: Specifies the used probe attenuation.
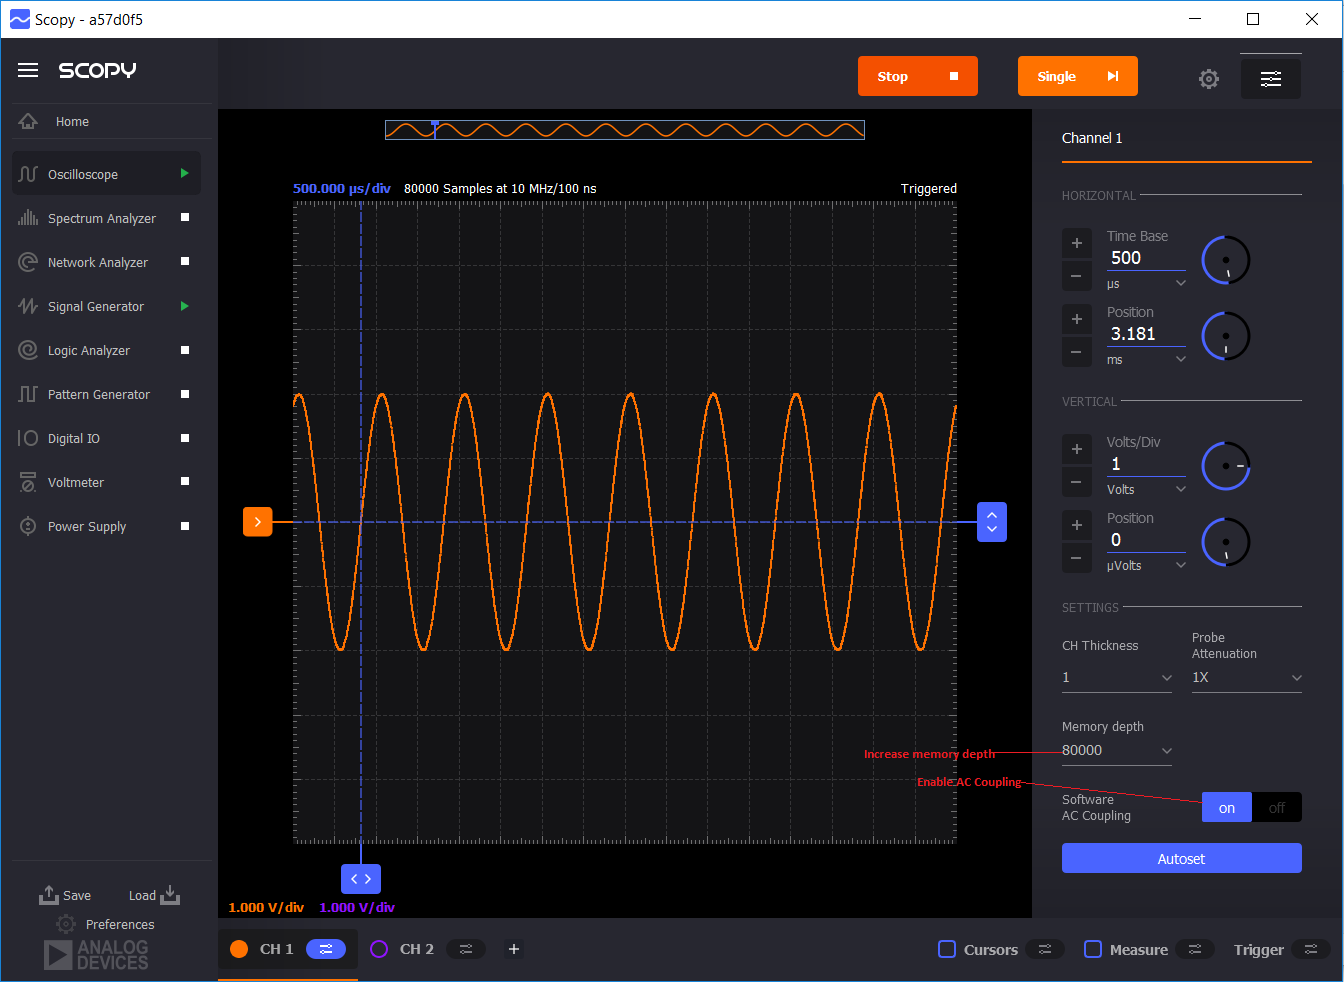
Memory Depth: This control provides a couple of values corresponding to each time base value. It increases the number of samples acquired and the sample rate.
Software AC Coupling: If enabled, this blocks the DC component of the signal. It is useful when the signal is too large for the current plot settings, seeing how it centers the signal at zero volts.
Autoset: Automatically adjusts the offset, range, frequency and trigger configuration based on the input signals. The user should start the Oscilloscope before using this feature.

When pressing the General Settings button on the right side panel a checkbox will appear, providing the option to compute and plot the FFT and the XY view of the acquired signals. As shown in the following illustration, if the XY view is enabled, a new section appears in the right side menu, allowing the user to choose the channels used for each axis of the plot and the plot type.
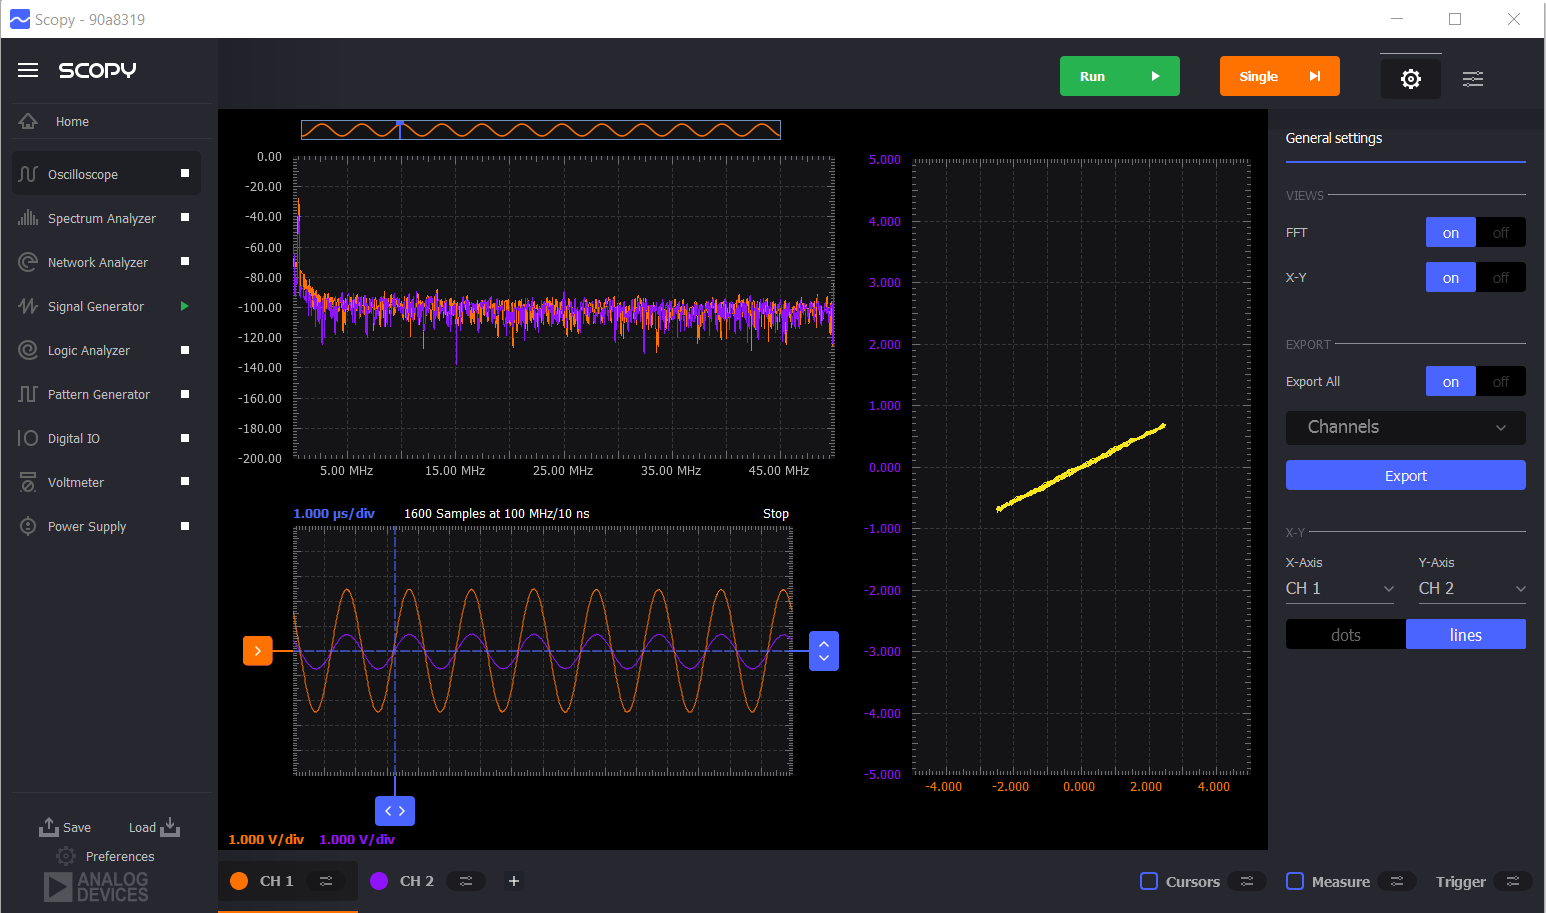
The Oscilloscope can export current data in .csv format. In order to open the export settings panel, click the wheel button located on the top right side of the screen. Using the “Export All” switch you can select and export data from all the available channels or you can create a custom selection using the dropdown. After deciding which channels should be exported, click “Export” and choose a file.
Pressing the (+) button on the right side of the two channels selection buttons will open a panel which allows the user to add Math channels or Reference channels. In the Math panel, the user can compute different equations by using also the signals acquired through the channels. After the equation is defined, by pressing the “Apply” button, the function is validated. Then, by pressing “Add channel”, a new channel is added and the plot of the equation is displayed.
The small white squares to the right of the instrument names control the run/stop functions of the instruments, allowing the user to run and stop an instrument without having to have that instrument in the current display. Clicking on the oscilloscope name invokes the top level of the Scopy two-channel oscilloscope, which appears as in the following illustration.
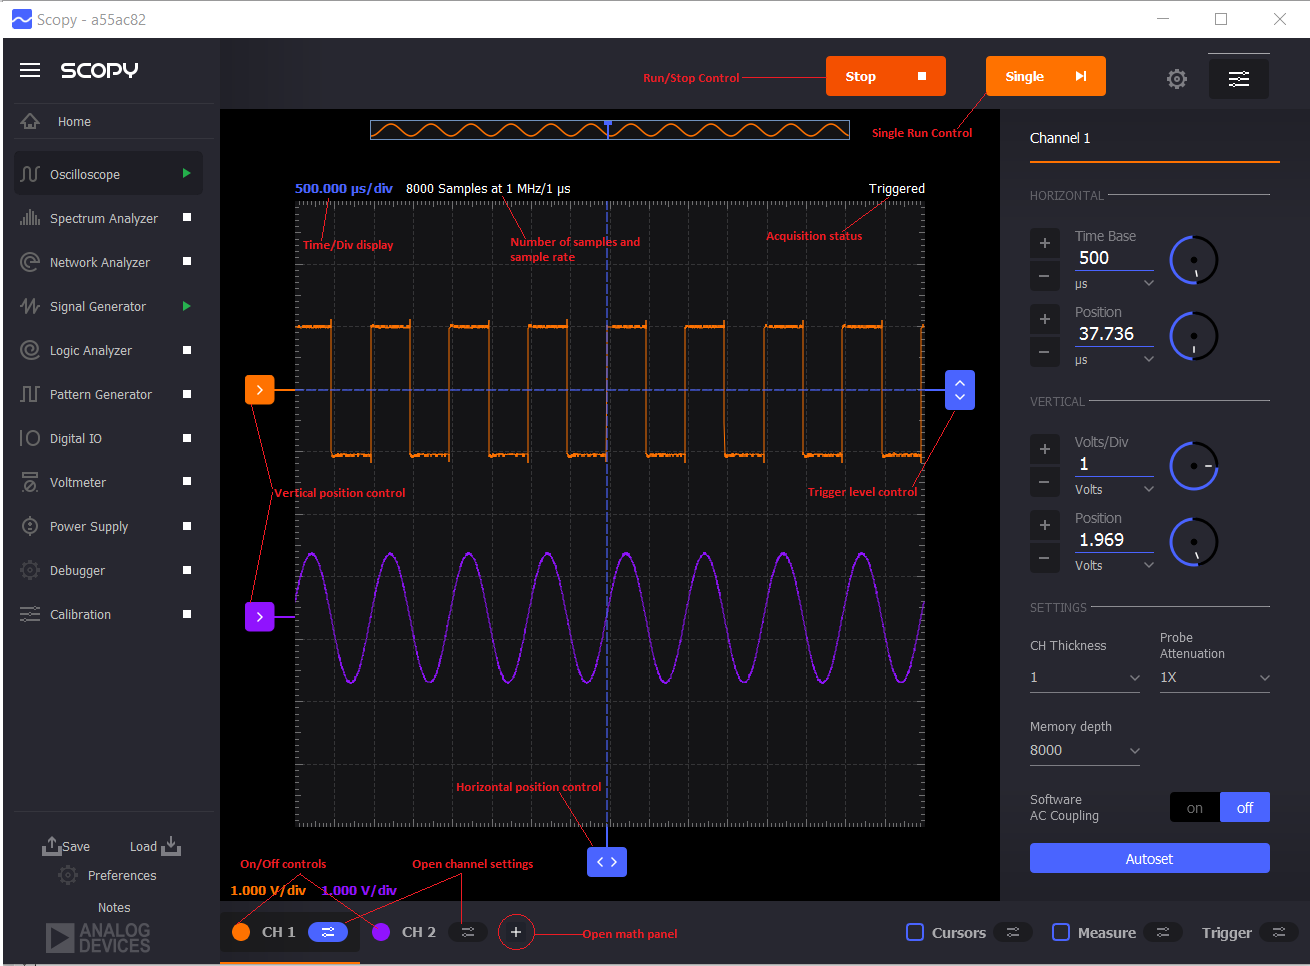
Channel 1 is turned on and off by clicking on the orange circle and Channel 2 is turned on and off by clicking on the purple circle. A channel that is on is indicated by a filled-in circle and a channel that is off is indicated by an empty circle. Scope waveform colors correspond to the circle colors.
Setting Up a Test Signal
A signal source is required in order to introduce basic oscilloscope operation, so we will use the Scopy two channel signal generator to generate sine waves to apply to the two oscilloscope channels. The oscilloscope has two balanced inputs and the signal generator has two unbalanced outputs, so we can connect the positive sides of the oscilloscope inputs to the signal generator outputs and the negative sides of the oscilloscope inputs to ground. A four-pin single-row header is useful to make these connections, and the wire connections are as follows:
Yellow-to-Orange (Signal Generator 1 Output to Oscilloscope 1 Positive Input)
Black (Adjacent to Yellow)-to-Orange/White (Ground to Oscilloscope 1 Negative Input)
Yellow/White-to-Blue (Signal Generator 2 Output to Oscilloscope 2 Positive Input)
Black (Adjacent to Yellow/White)-to-Blue/White (Ground to Oscilloscope 2 Negative Input)
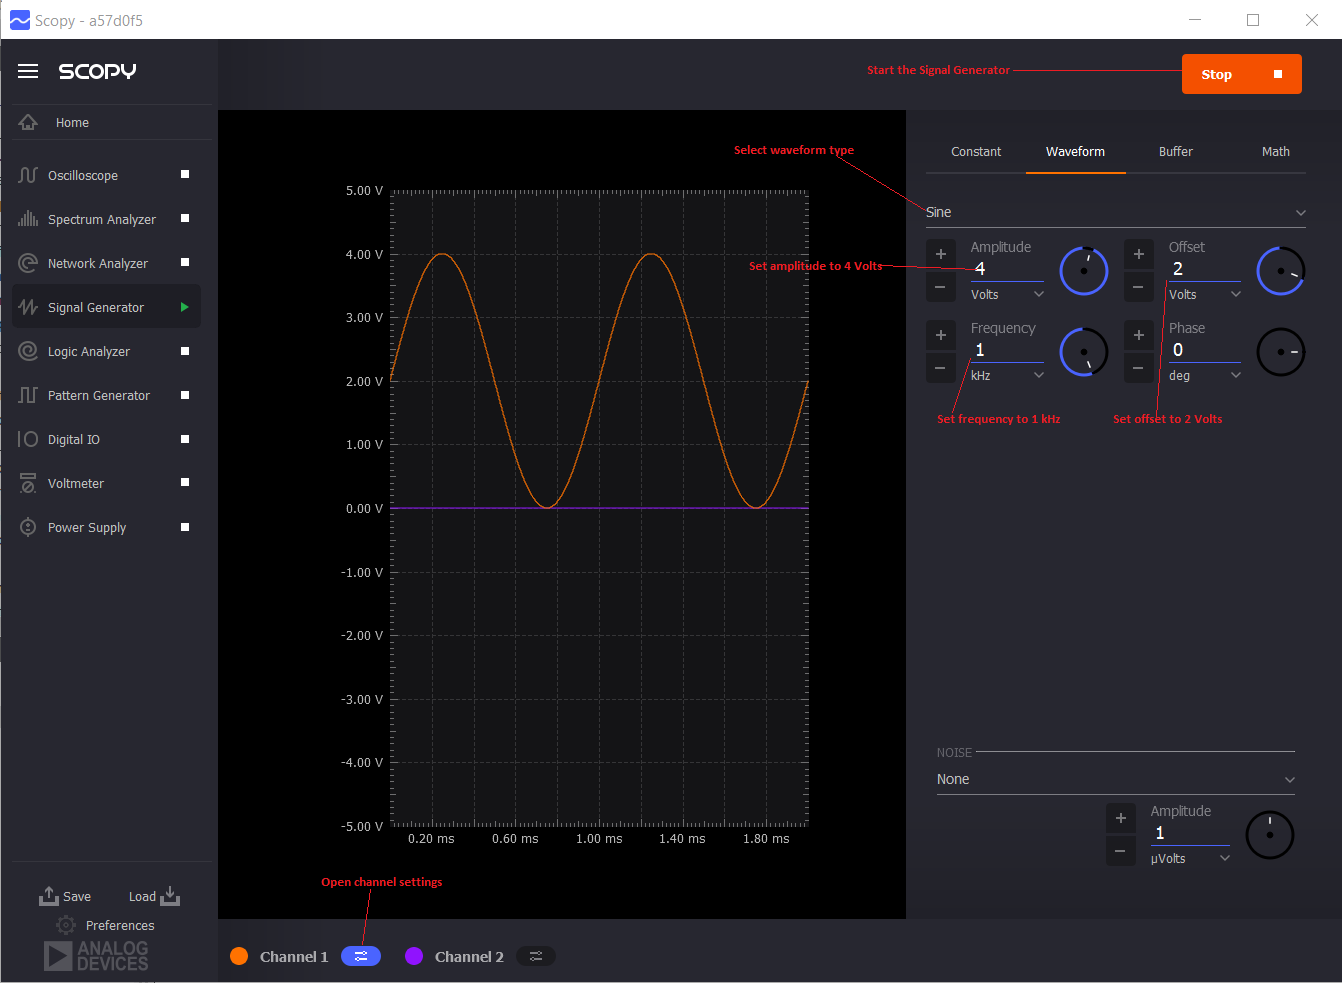
The signal generator is invoked by clicking on the “Signal Generator” name in the instrument menu. The signal generator initializes with both channels turned on and only requires the waveform, amplitude, and frequency to be selected. Click on the Channel 1 menu and set the Waveform for “Sine,” Amplitude for 4 Volts, Frequency for 1 kHz and the offset for 2 Volts. When the setup is complete, press “Run” as shown in the following illustration. Entries may be made by entering numbers directly and hitting “Enter” or by clicking on the “+” and “-” controls, and the units can be directly selected under the numbers.
Setting the Horizontal and Vertical Scales
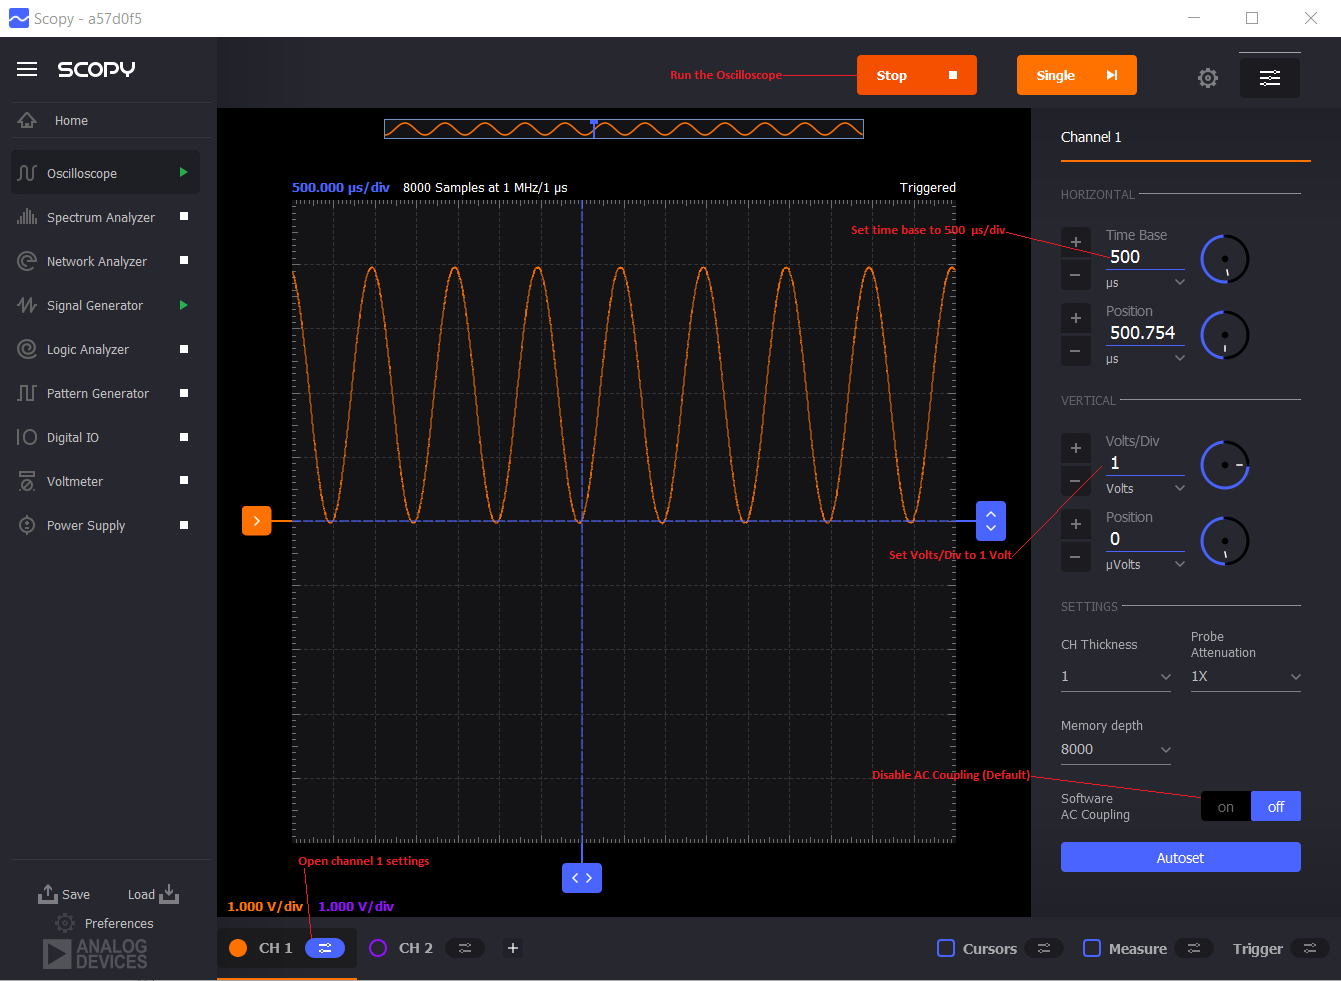
Open the dual channel oscilloscope by clicking on the “Oscilloscope” name in the instrument menu. The oscilloscope initializes with both channels active so Channel 2 should be turned off in order to view Channel 1 only. Open the channel settings for Channel 1 and disable the Software AC Coupling. Then set the Time Base for 500 μs/Div and the Vertical Scale for 1 V/Div and click “Run” as shown in the following illustration.
In order to block the DC component of the signal, enable the AC Coupling feature for the first channel. The signal should now be centered at zero volts. You can also change the memory depth using the dropdown, increasing the number of samples and the sample rate, as shown in the following illustration. If the horizontal trigger position is modified while in memory depth mode, the memory depth will be set to the default version, because the number of samples before the trigger is limited to 8k.
Oscilloscope Triggering
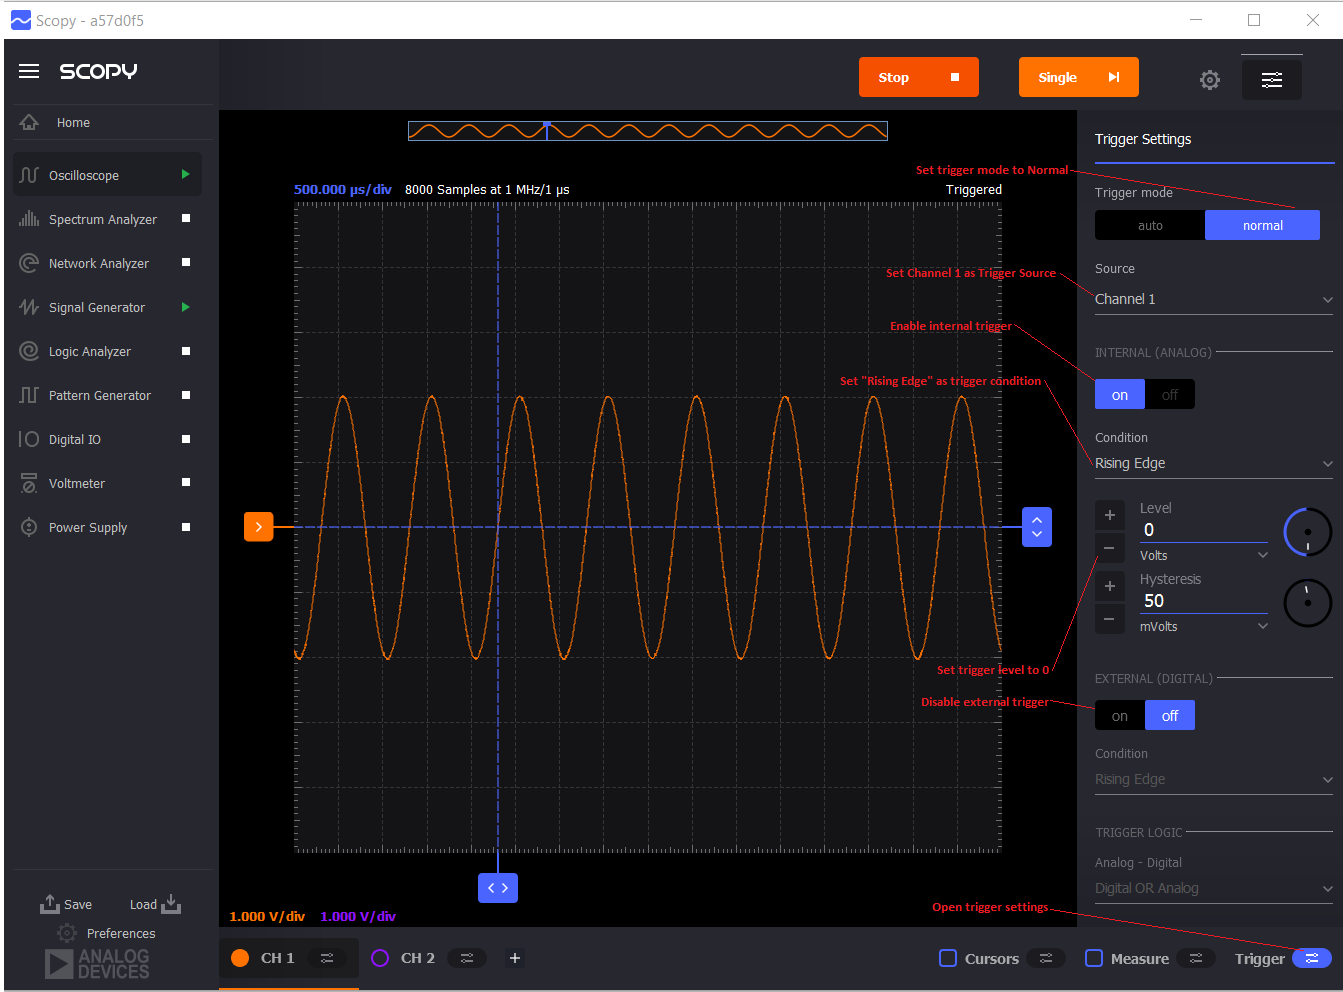
Basic oscilloscope trigger settings are made by clicking on the “Trigger” menu, which appears as shown in the illustration below. For this example, we have configured the oscilloscope to trigger on the rising edge of the Channel 1 input signal at a level of 0 volts. Hysteresis is also provided to improve triggering performance on noisy trigger signals. The hysteresis value is then set for the channel used as a trigger source.
Making Signal Measurements Using Cursors
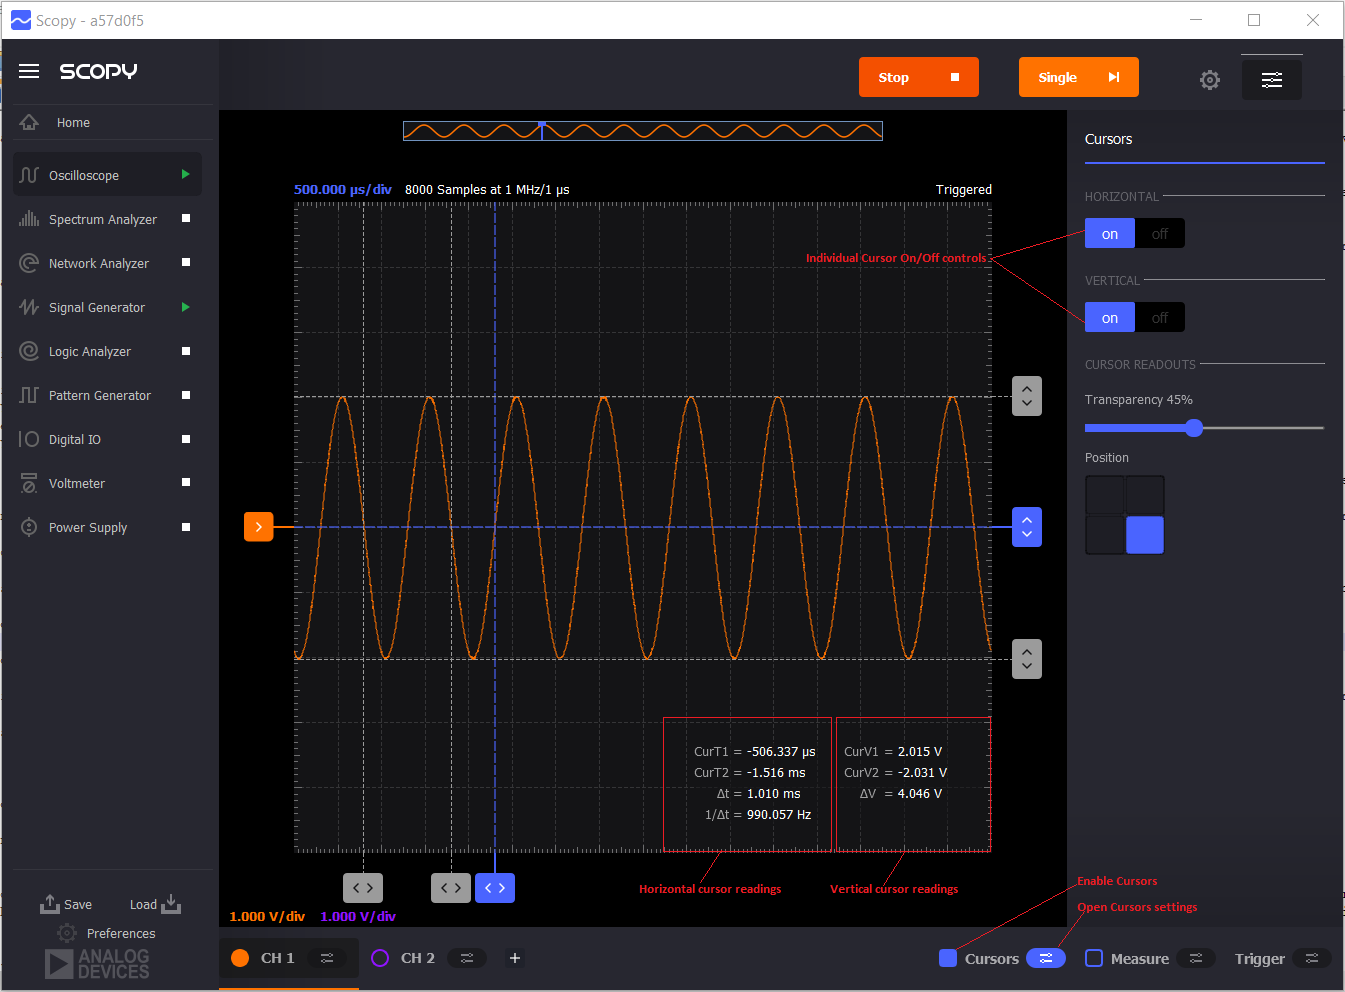
Measurement cursors are available for the timebase and vertical scale, and are accessed by clicking on the “Cursors” control located in the lower right section of the Scopy display. The cursor menu is accessed by clicking on the menu icon next to the “Cursors” label. The cursor menu appears to the right in the Scopy display, and allows each cursor pair to be individually turned on and off. The timebase cursors indicate absolute time relative to the horizontal position control as well as Δt and frequency calculated as 1/Δt. The vertical scale cursors indicate absolute voltage as well as ΔV. Cursors are moved by dragging the up/down arrow controls located at the cursor ends.
The Cursor Readings can be displayed in any corner of the plot, using the Position control from the right side menu. Also, for the transparency of the Readouts can be modified using the corresponding control from the right side menu. The following illustration shows the 4 V 1 KHz signal with the vertical and horizontal cursors on.
Using Built-In Signal Measurement Features
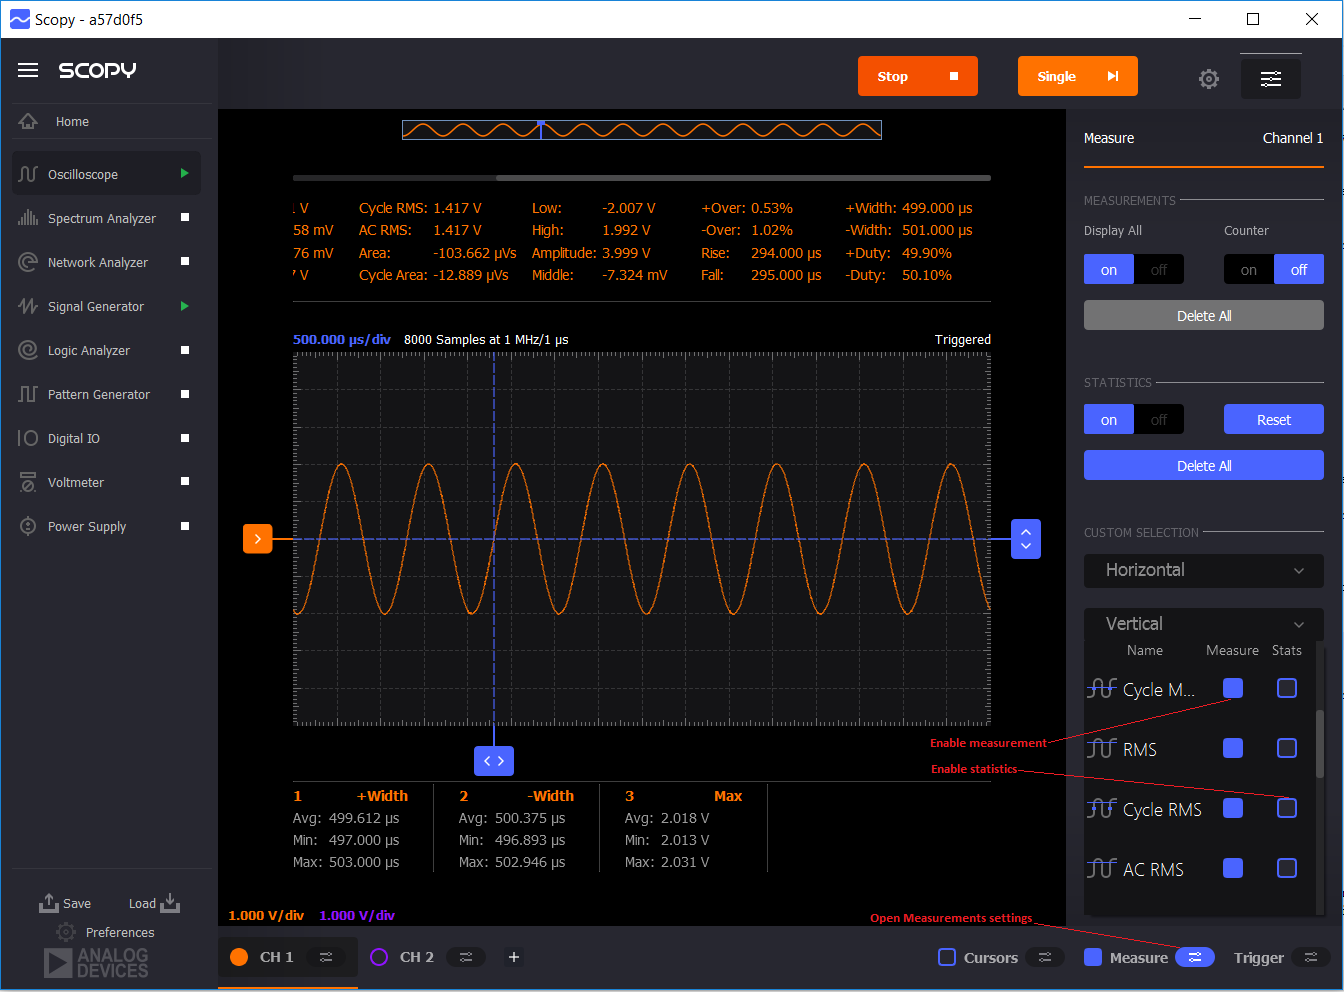
Mathematical calculations can be made by Scopy directly on the sampled data, and are accessed by clicking on the “Measure” control located in the lower right section of the Scopy display. The measurement menu is accessed by clicking on the menu icon next to the “Measure” label. The measurement menu appears to the right in the Scopy display, and makes many signal measurements available to the user. The following illustration shows all available signal measurements that can be accessed by switching the “Display All” feature to “on.”. Measurements and statistics can be activated using the “Display All” feature, or separately, using the custom dropdown as shown in the following illustration.
Working with Math Channels
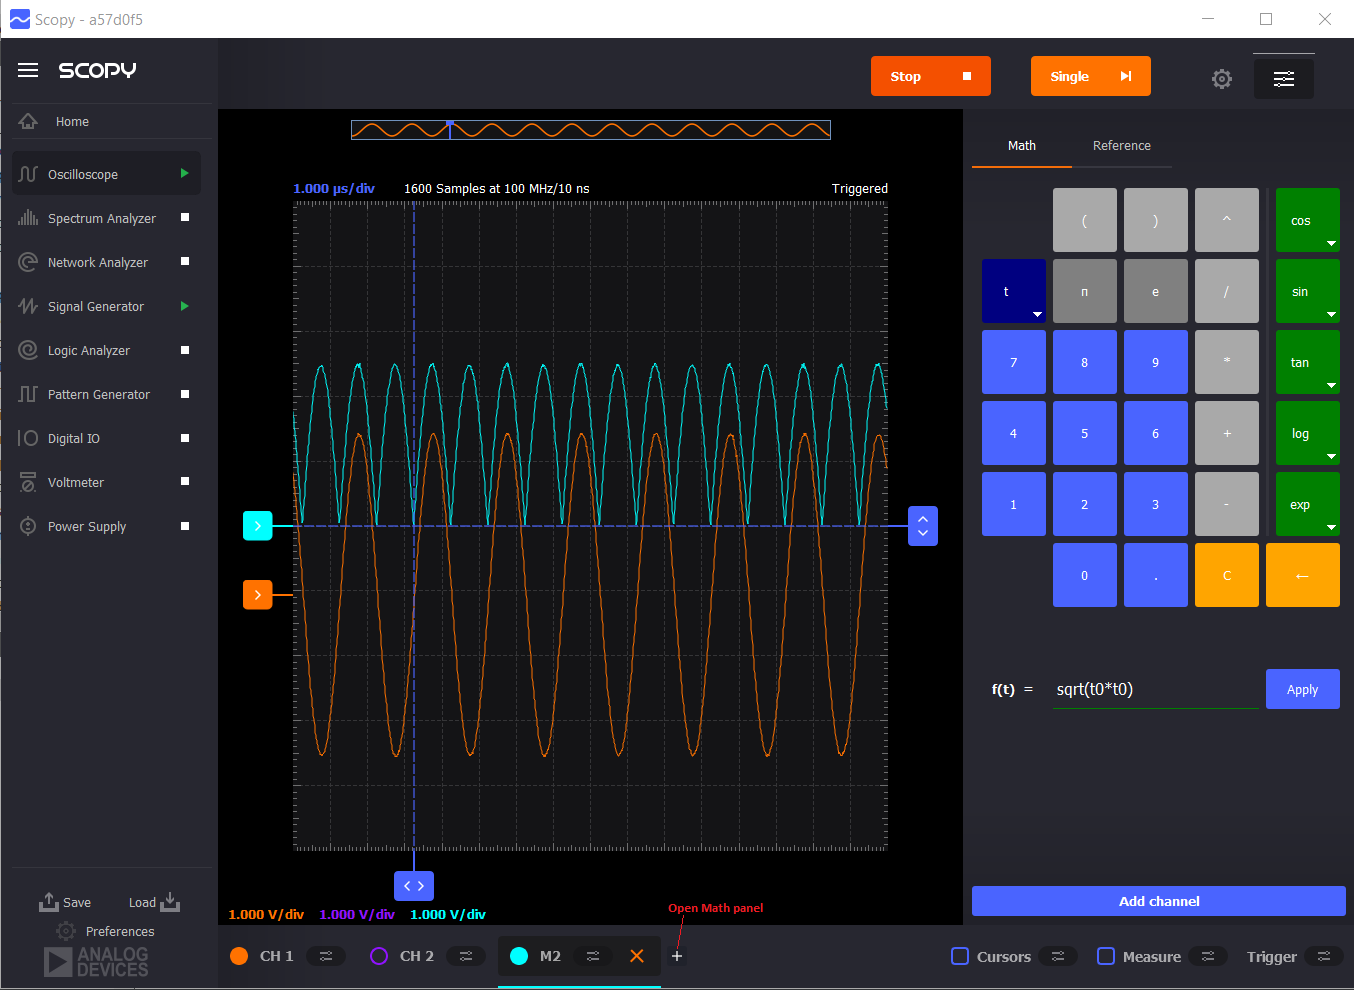
Math channels can be added to the instrument by clicking the plus(+) button located in the bottom menu bar, next to “Channel 2”. The opened menu will provide controls for adding Math channels and Reference Channels. If the Math tab is chosen from the panel, the math configuration menu will open and provide controls to insert a math expression for the channels that is about to be added. The expression can be typed directly or edited by using the math pad which contains digits, various math functions, math operations and a drop-down “t” that represents the data from the hardware channels. The next step is to click the “Apply” button that checks if the expression is valid. The line under the expression will turn green for valid expressions and red otherwise. In this example set f(t) = sqrt(t0 * t0) in order to create a math channel that contains the absolute values of Channel 1. Finally, to add the math channel a click to the “Add channel” is required. The newly added channel will be added in the bottom menu bar and can be deleted any time by clicking the X button next to the channel name. All actions described above can be visualized in the illustration below.
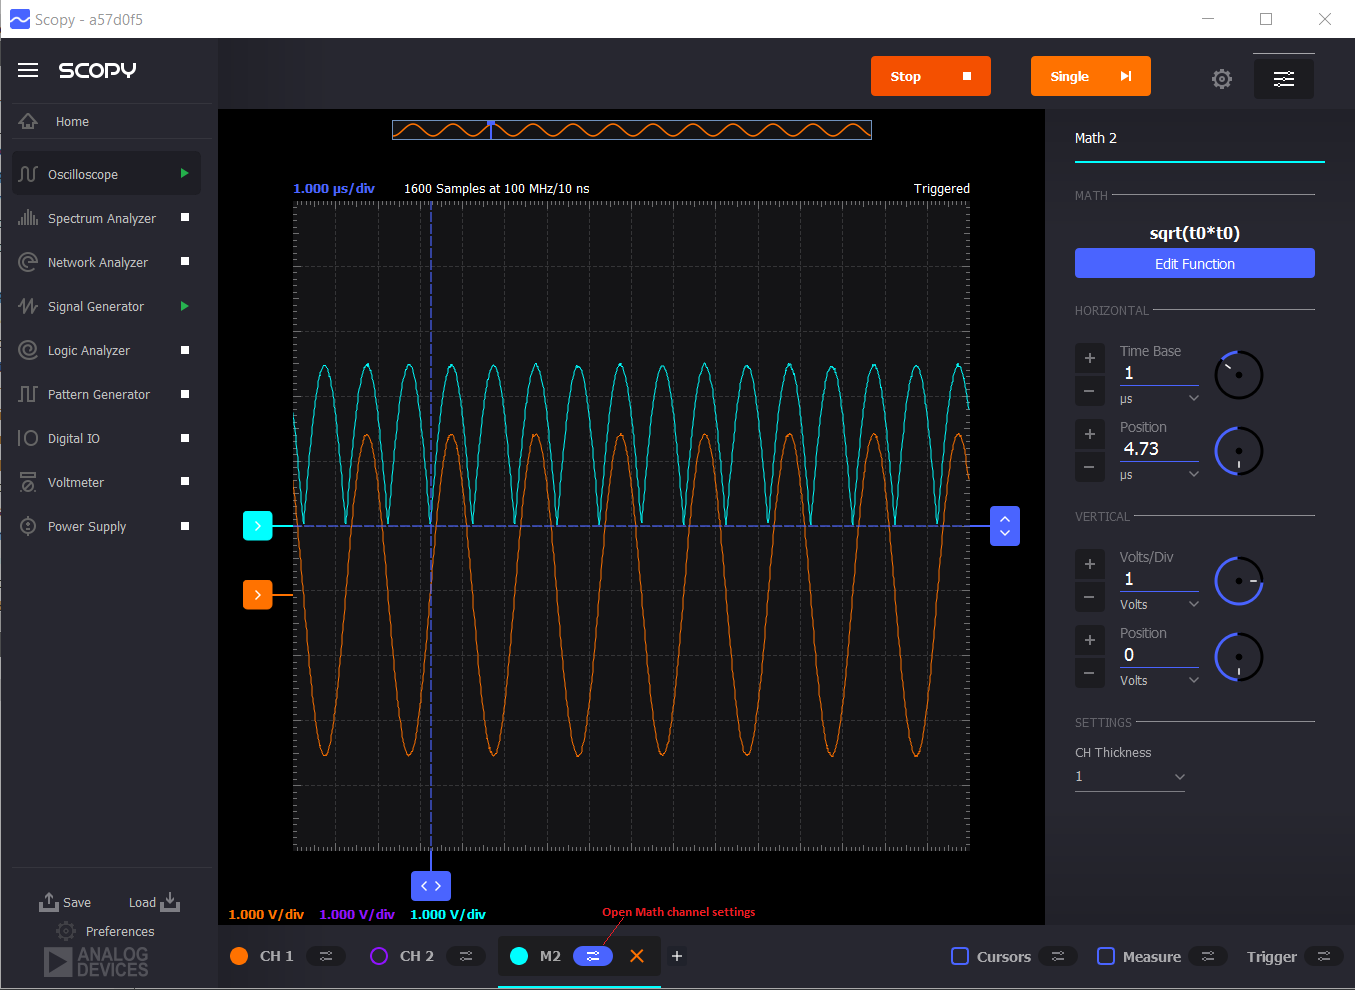
The expression of a Math channel can be edited after the channel was added to the list. In order to do this, you need to open the Math Channel Settings as shown in the following illustration. In the Math Channel Settings, the expression and a button named “Edit function” are displayed. The “Edit function” button will open a math panel, similar to the one used to add a new math channel. You can modify the function, then click “Save” and all the settings will be updated.
Working with Reference Channels
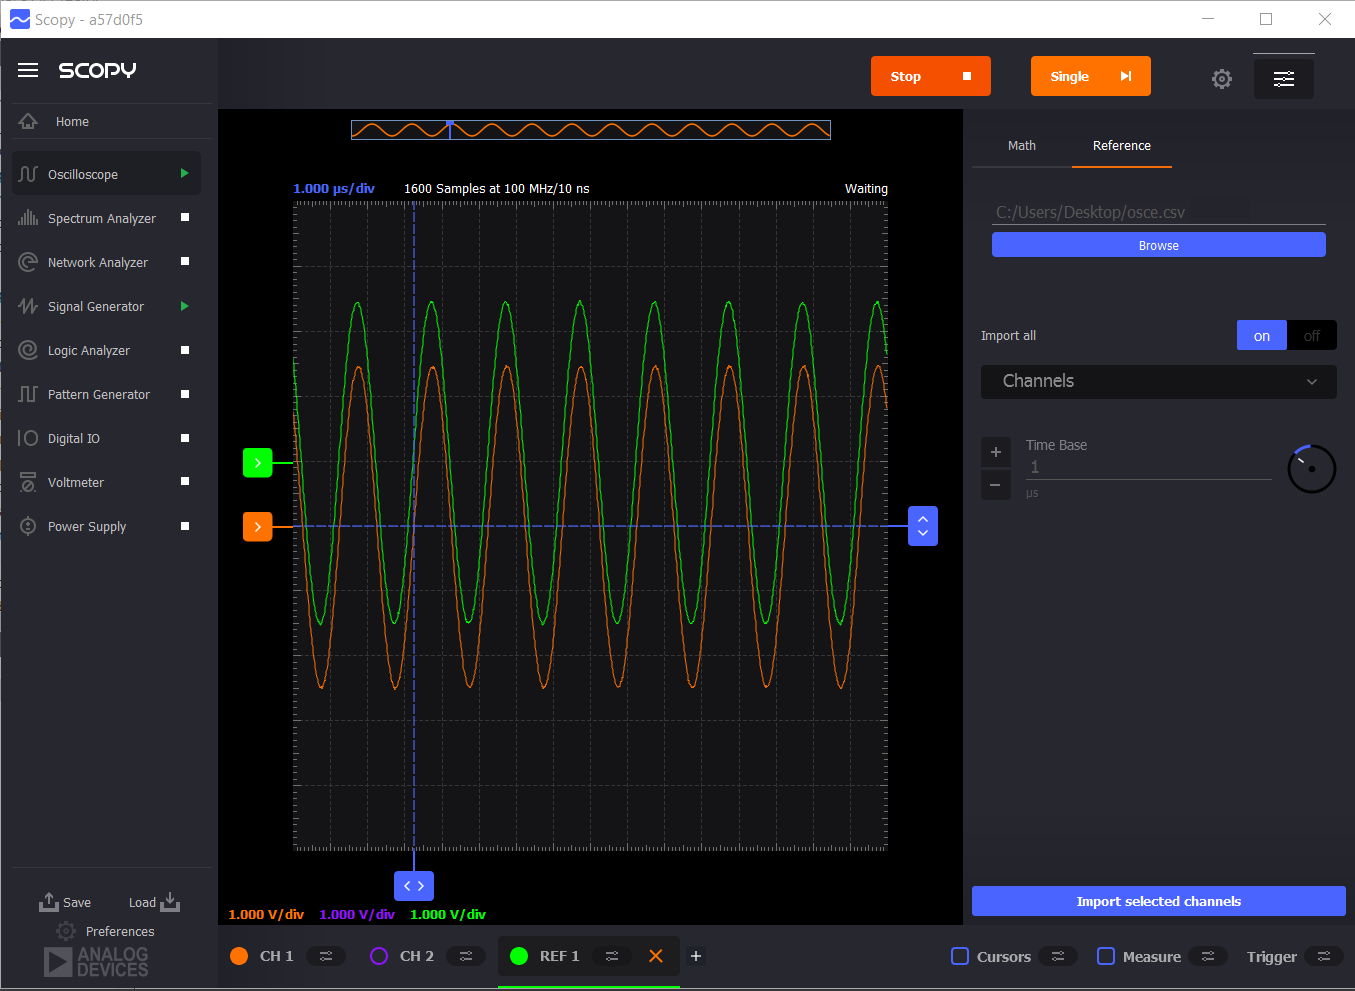
Using the same (+) button, described in the previous section, the Reference tab can be selected. This loads a configuration panel, which allows you to load a previously captured signal from a .csv file. After choosing the file, select which channels should be imported (or use the “Import all” switch) and click “Import selected channels”. This will add a new channel in the bottom bar menu. Similar to the Math channels, the Reference channels can be deleted any time by clicking the X button next to the channel name.
Working with Mixed Signal View
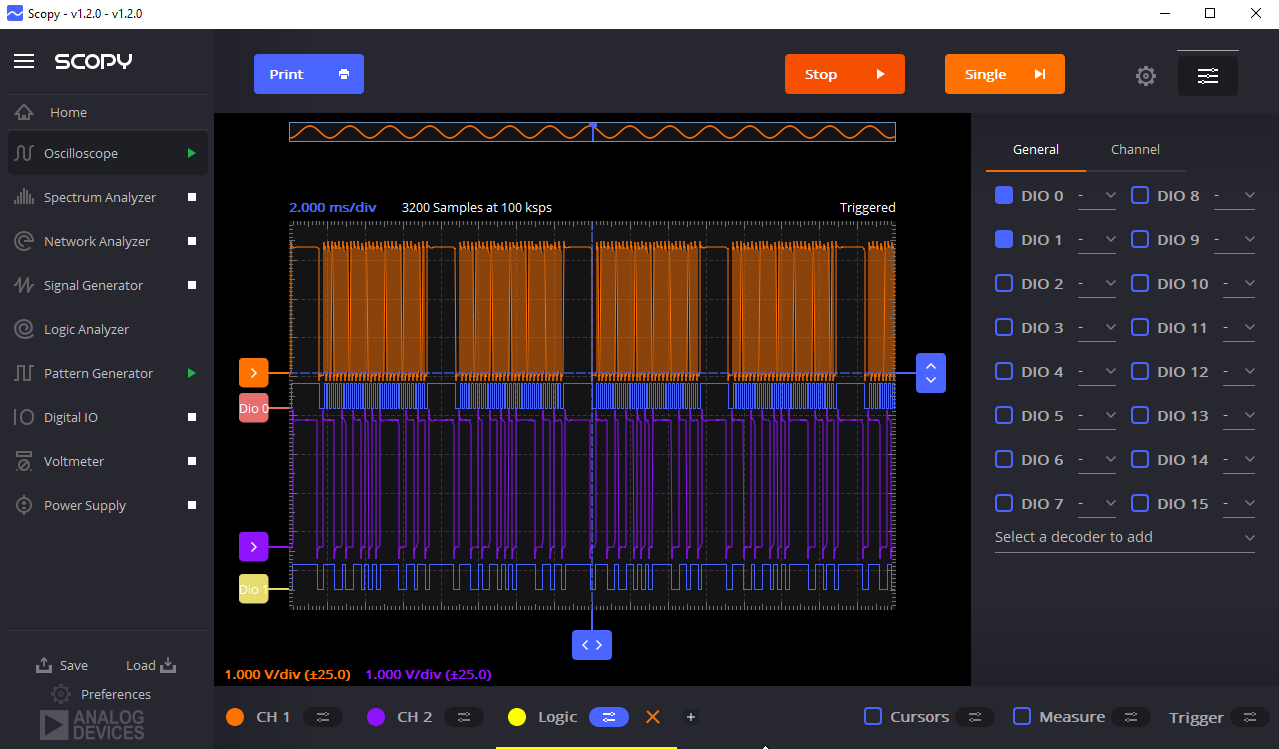
Using the same (+) button, described in the previous section, the Logic tab can be selected. Here there will be some information regarding how the Mixed Signal View will work and the option to enable it.
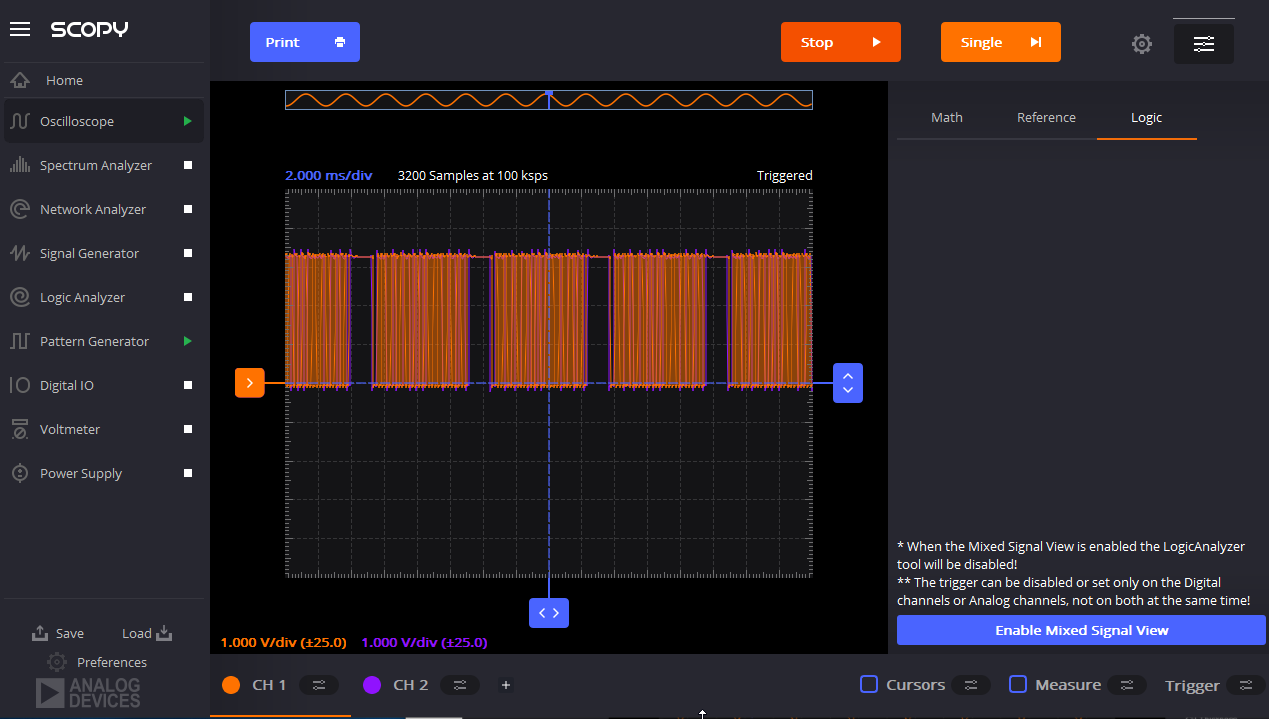
After clicking enable a Logic widget should be added at the bottom. Clicking on the settings here will open a menu similar in usage to the Logic Analyzer. Here digital channels can be enabled / disabled, decoders can be added and so on. The samplerate of the digital and the number of samples to capture is computed from the parameters of the Oscilloscope
