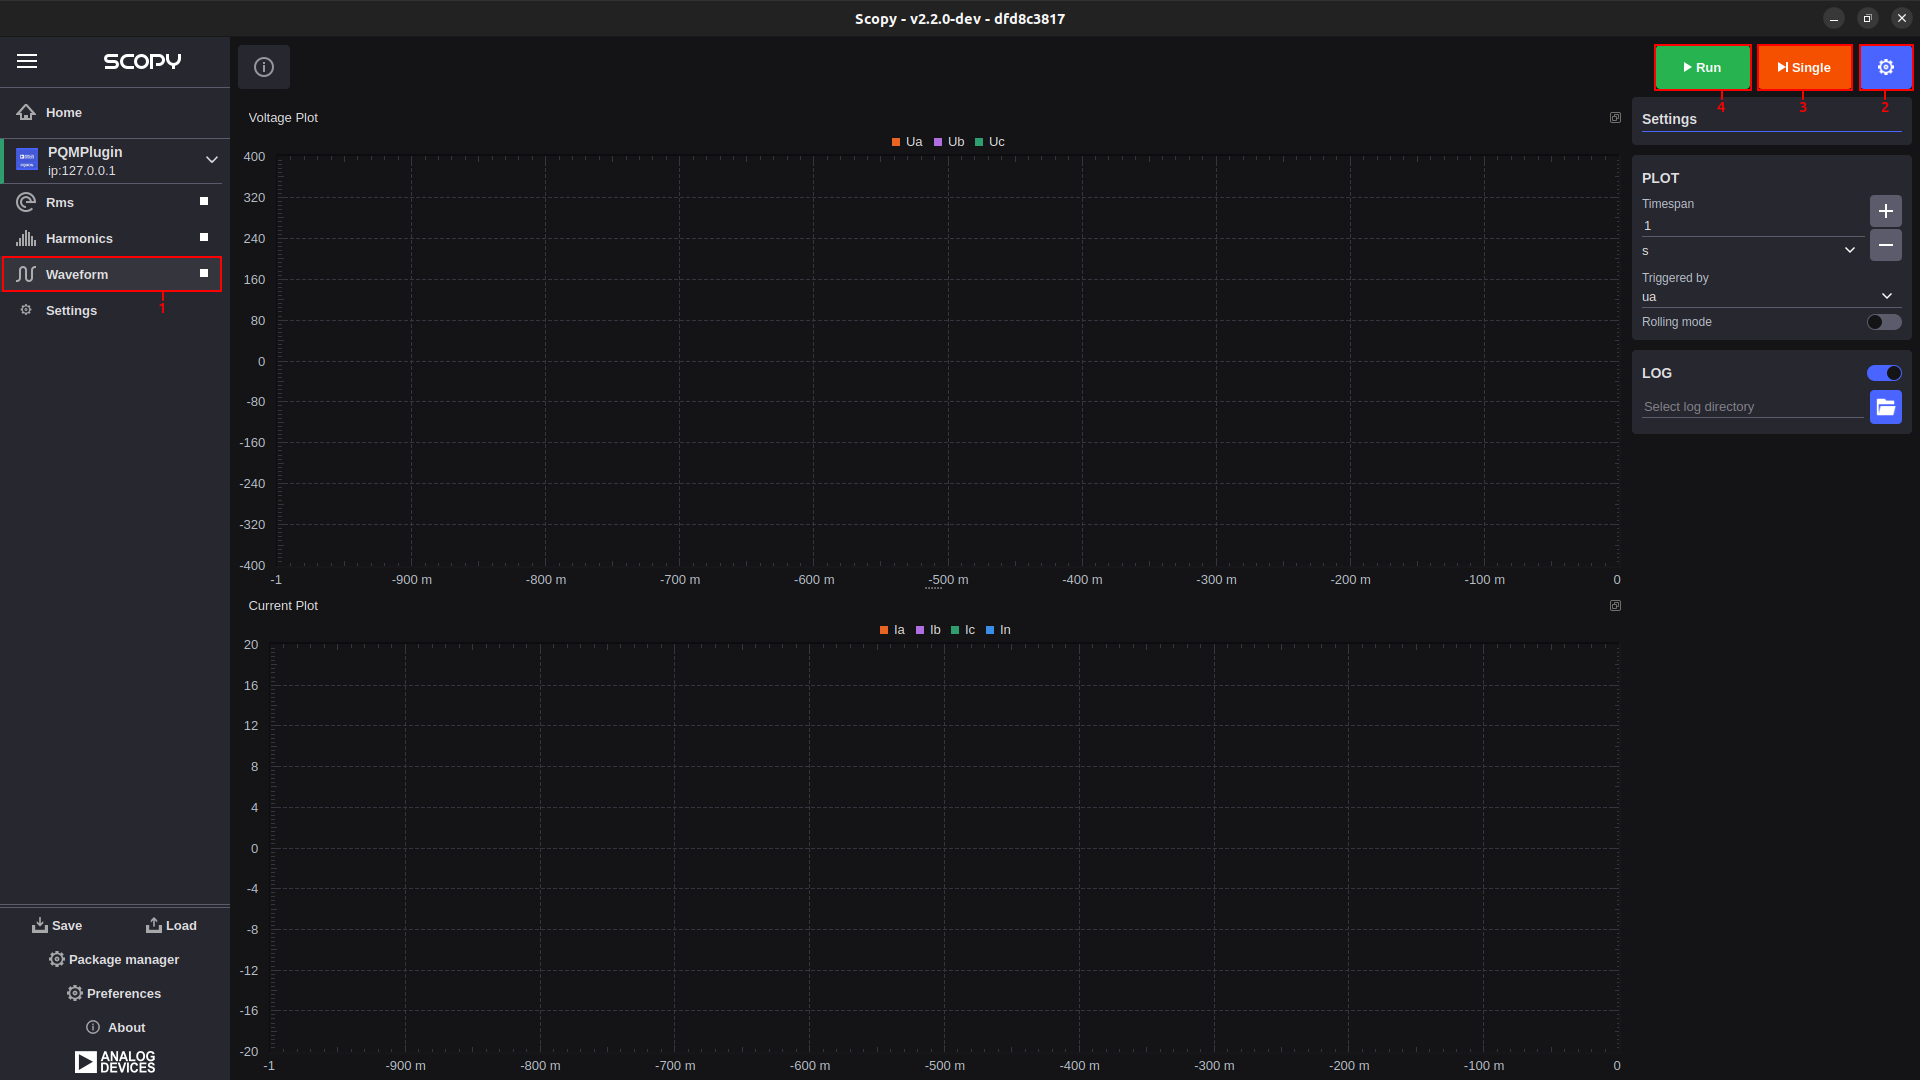
Waveform
The main purpose of this instrument is to display the waveform of the voltage and current for each phase. In one second, 10 cycles should be displayed at a frequency of 50 Hz, or 12 cycles at a frequency of 60 Hz.
All widgets in the Waveform instrument are dockable, allowing users to customize the workspace by arranging and resizing components.
The instrument is divided into two sections:
Voltage plot: Shows voltage waveforms (top).
Current plot: Shows current waveforms (bottom).
User Guide
From the menu on the left, you can select the desired instrument. To the right of the name, there is a button that allows you to start or stop data acquisition.
Clicking the settings button brings up the settings menu.
By pressing the “Single” button, a single batch of data is acquired.
By pressing the “Run” button, continuous data acquisition starts.