RMS
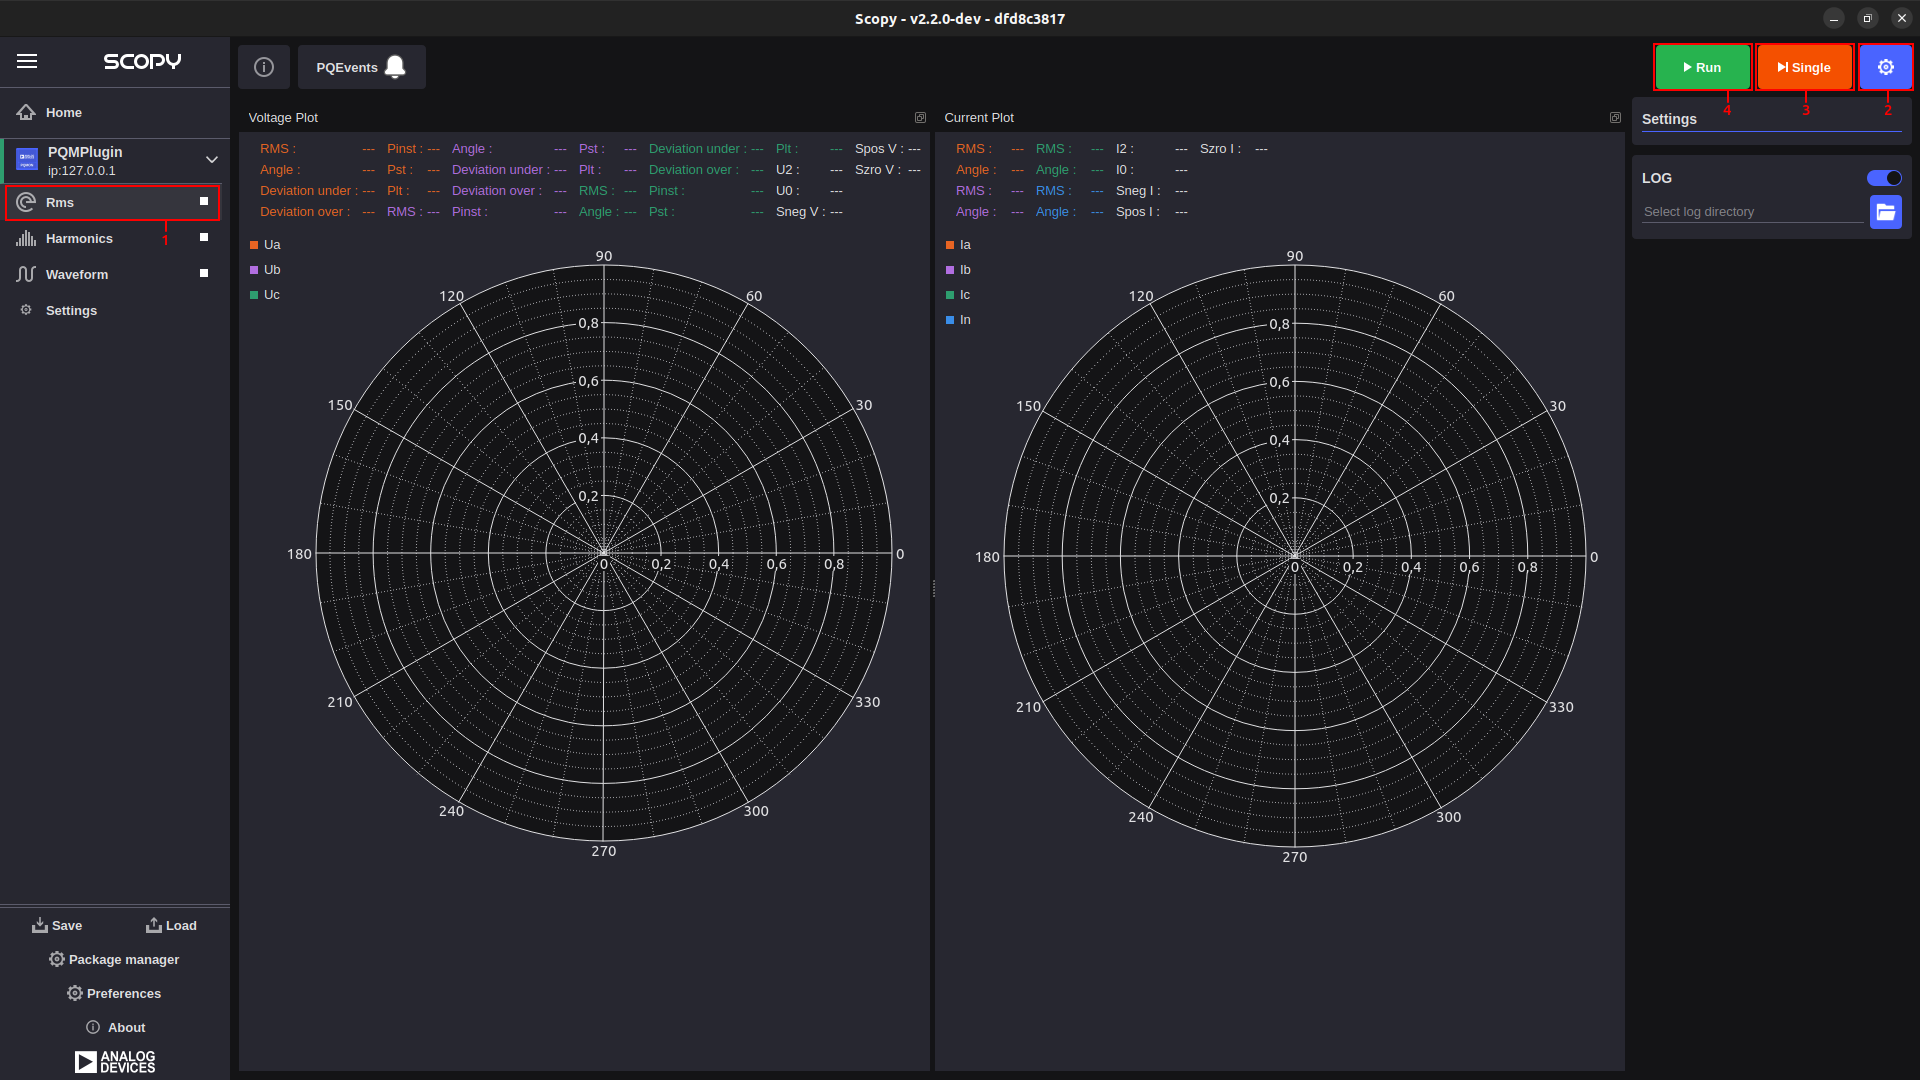
The main purpose of this instrument is to display and graphically represent the RMS and the angle of each phase (for both voltage and current). At the same time, information such as voltage and current unbalance or flicker data can also be inferred from here. Each time new data is available, the tool updates accordingly.
All widgets in the RMS instrument are dockable, allowing users to customize the workspace by arranging and resizing components.
The instrument is divided into two sections:
Voltage: Shows the details of the voltage (left side).
Current: Shows the details of the current (right side).
User Guide
From the menu on the left, you can select the desired instrument. To the right of the name, there is a button that allows you to start or stop data acquisition.
Clicking the settings button brings up the settings menu.
By pressing the “Single” button, a single batch of data is acquired.
By pressing the “Run” button, continuous data acquisition starts.
PQ Events
The PQEvents button is used to notify the user when a specific power quality event has occurred. When the user clicks on the PQEvents button, it resets and waits for the next event to occur. All detected events can be viewed in the log if logging is enabled for the instrument.