Voltmeter
Video guide:
General Description
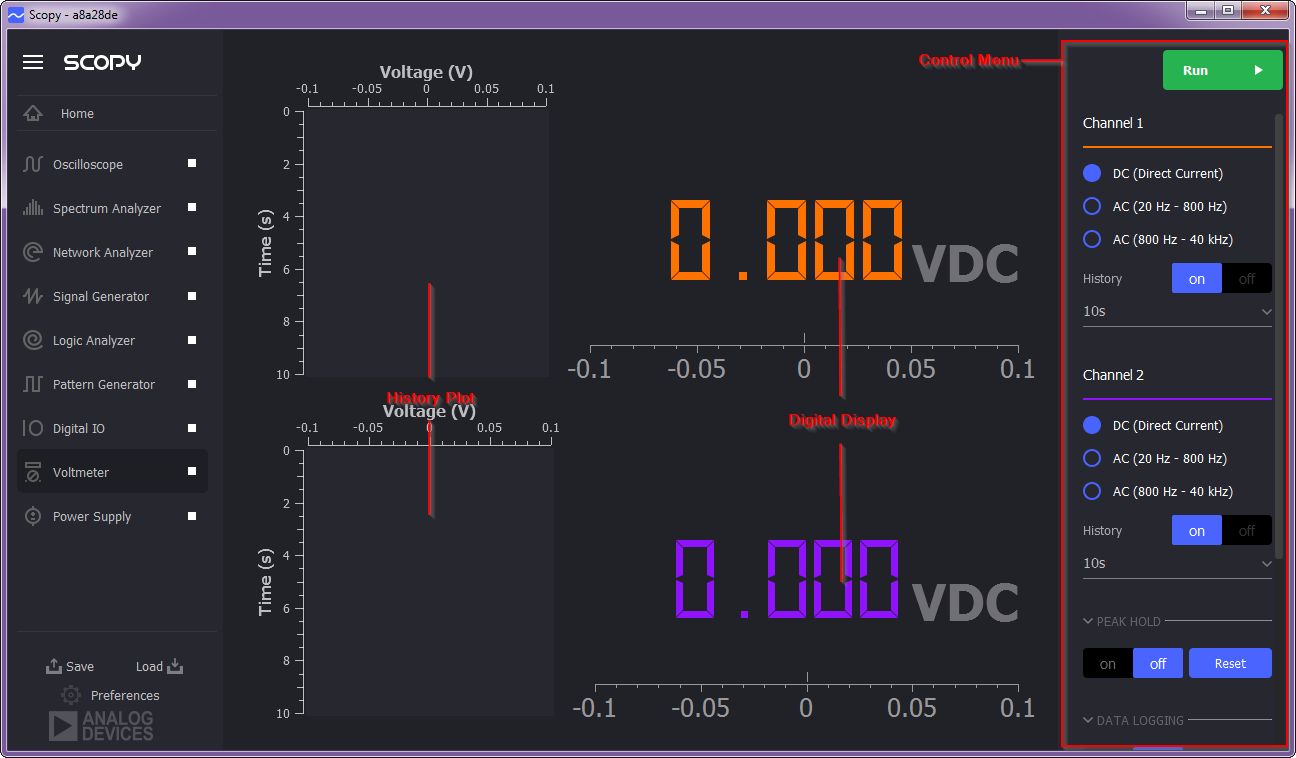
The voltmeter instrument displays the voltage readings on the two channels of the ADC.
Open the Voltmeter instrument by clicking on the “Voltmeter” button displayed at the far left of the Scopy window. The voltmeter instrument makes use of the Oscilloscope probes 1 and 2 in the M2k for the channels which are capable of measuring DC and AC signals at ±25V.
Note
A Calibration feature automatically starts for the Voltmeter instrument when Scopy connects to an M2k device. Manual calibration is not necessary
Main Window

History Plot
The graphical representation of the voltage value over time for each channel is displayed. The history plot is in the form of a strip chart where the voltage amplitude is plotted on the x-axis and time is plotted on the y-axis. This may be turned off in the control menu.
Digital Display
The numerical value representation of the voltage reading on both channels are displayed present in this section. The voltage value displayed may either be in VDC in Direct Current mode or Vrms in AC Mode.
AC/DC Modes

AC/DC mode may be set independently for each channel. AC Mode will display the VRMS value of the signal and is optimized for frequencies between 20Hz to 40kHz, this range of frequency is separated in two options.
The first option is frequency range from 20Hz to 800Hz and the second option is from 800Hz to 40kHz. When the signal’s frequency is not within the range of the option selected, there will be no reading in the instrument.
DC Mode will display the VDC value of the signal from -25V to 25V.
History

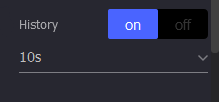
The Voltmeter features one Voltage-over-time history plot per channel. These can be independently enabled and disabled by toggling the ON/OFF switches on the right-side menu. There’s a selector below the ON/OFF switches.
By default, the plot will represent 10 seconds of data. This selector will allow you to choose the history duration between the three choices: 1 second, 10 seconds, 60 seconds.
Data logging

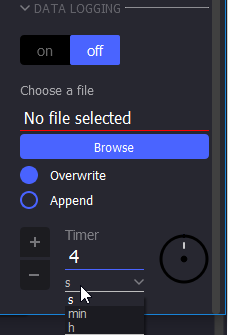
The data logging can be enabled or disabled using the ON/OFF switch in the right-side menu. A file can be chosen clicking the Browse button
The Voltmeter can Overwrite or Append to the selected file by checking one of the options located below the file selector.
The timer control, located at the bottom of the right-side menu, controls the amount of data that will be logged. The accepted range of values for this control is between 0 seconds and 1 hour. By default, the spinbox is set to 0. In this case, each value displayed on the LCD will be written to the selected file. If the value is, for example, 4, the Voltmeter will log to file every 4 seconds.
Peak hold
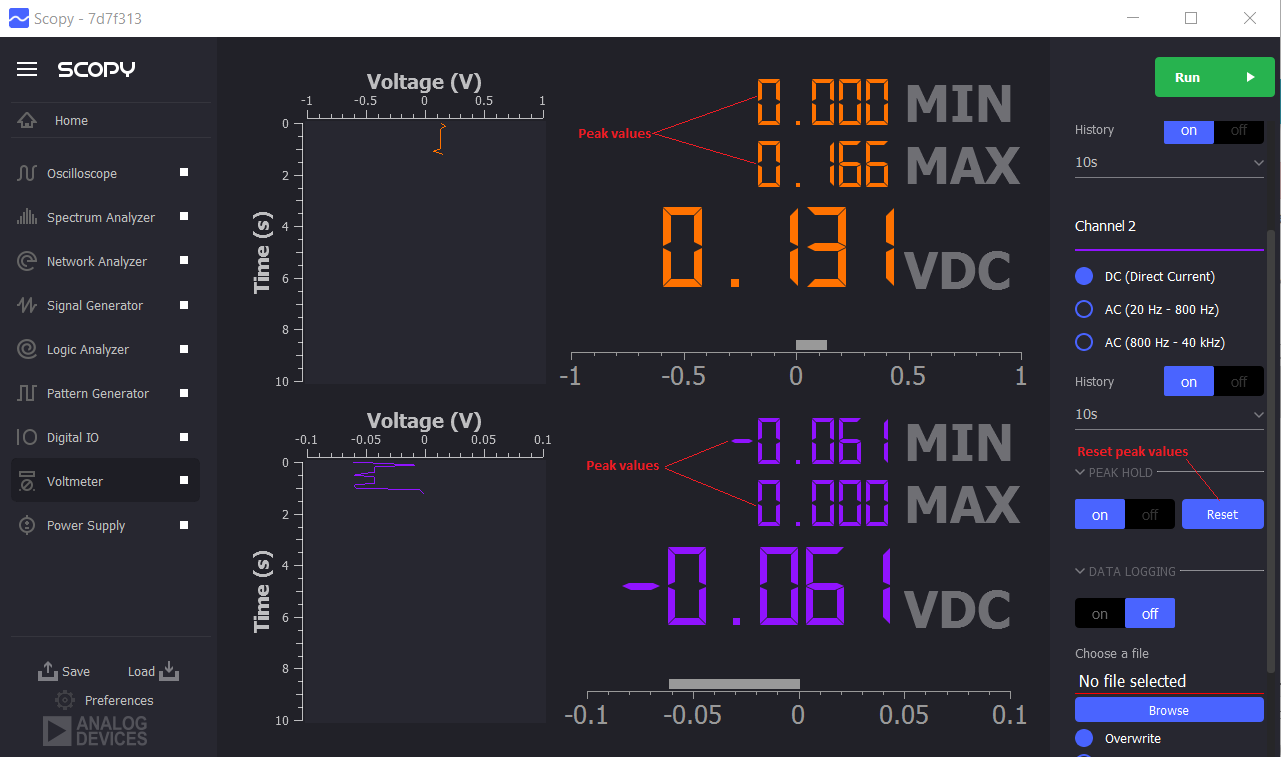
The peak hold functionality can be enabled or disabled using the ON/OFF switch in the right-side menu.
The min and max values are visible on the digital display and can be reset using the Reset button.
