Spectrum Analyzer
Video guide:
General Description
The Spectrum Analyzer instrument captures the signal in frequency domain where the signals are displayed as a function of their frequency. The M2K’s Spectrum Analyzer makes use of probes 1 and 2 which are capable of measuring signals at ±25V.
Warning
A Calibration feature automatically starts for the Spectrum Analyzer instrument when Scopy connects to an M2k device.
Spectrum Analyzer Front Panel
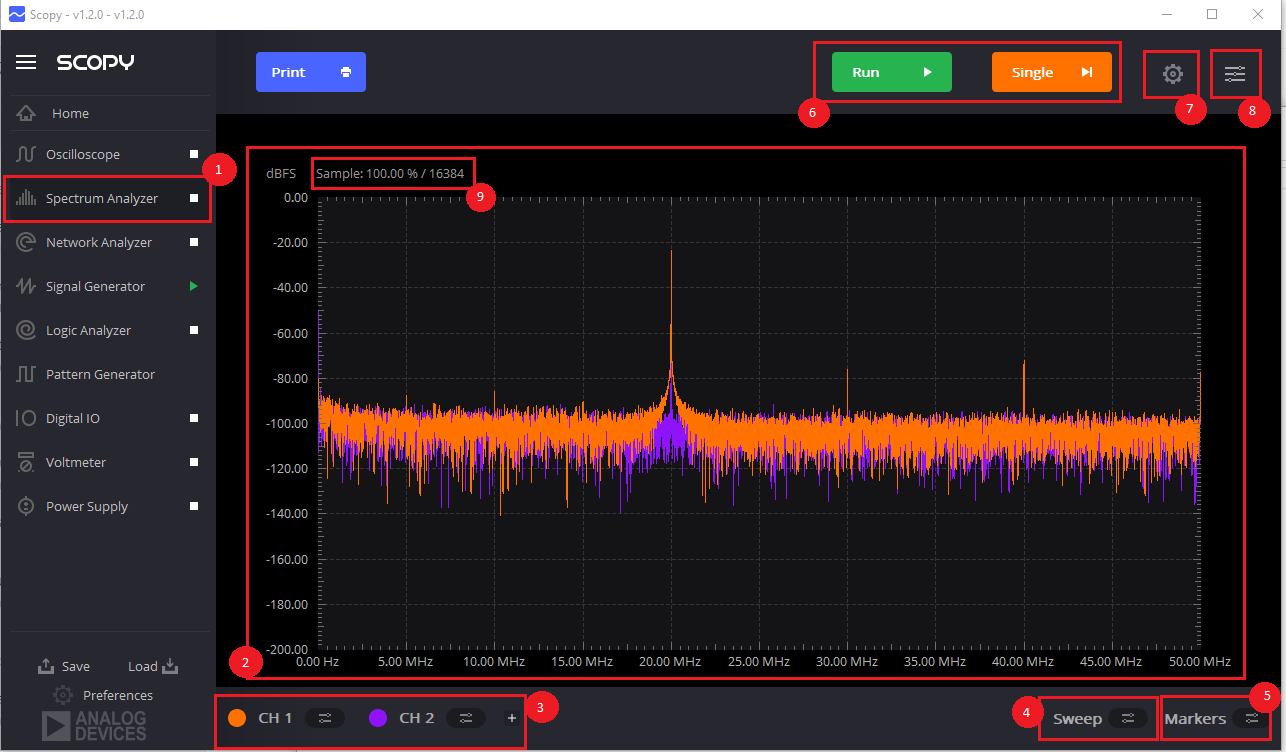
Spectrum Analyzer Tab: Clicking this tab brings out the Spectrum Analyzer instrument in front. The white box will allow the user to run/stop the Spectrum Analyzer while other instrument tab is open.
Signal Plot: Displays the signal in frequency domain. X-axis measures the frequency of the signal and Y-axis displays the amplitude in dBFS.
Channel Controls: Clicking the orange or violet button allows the user to enable/disable the channels. Clicking the button on the right of the channel will bring out the channel settings.
Sweep: Clicking the Sweep button will bring out the sweep settings that will allow the user to modify the signal plot window’s display.
Markers: Clicking the marker button will bring out the marker controls.
Run/Stop and Single Run: Clicking the Run button will allow the spectrum analyzer to continuously capture data. Clicking the Single button will allow the spectrum analyzer the capture the data once.
Instrument Settings: Clicking the instrument settings button will show the instrument settings panel.
Last opened panel: Clicking this button will bring out the last opened panel.
Acquisition status: Displays the percentage of acquired samples and the total number.
Channel Settings
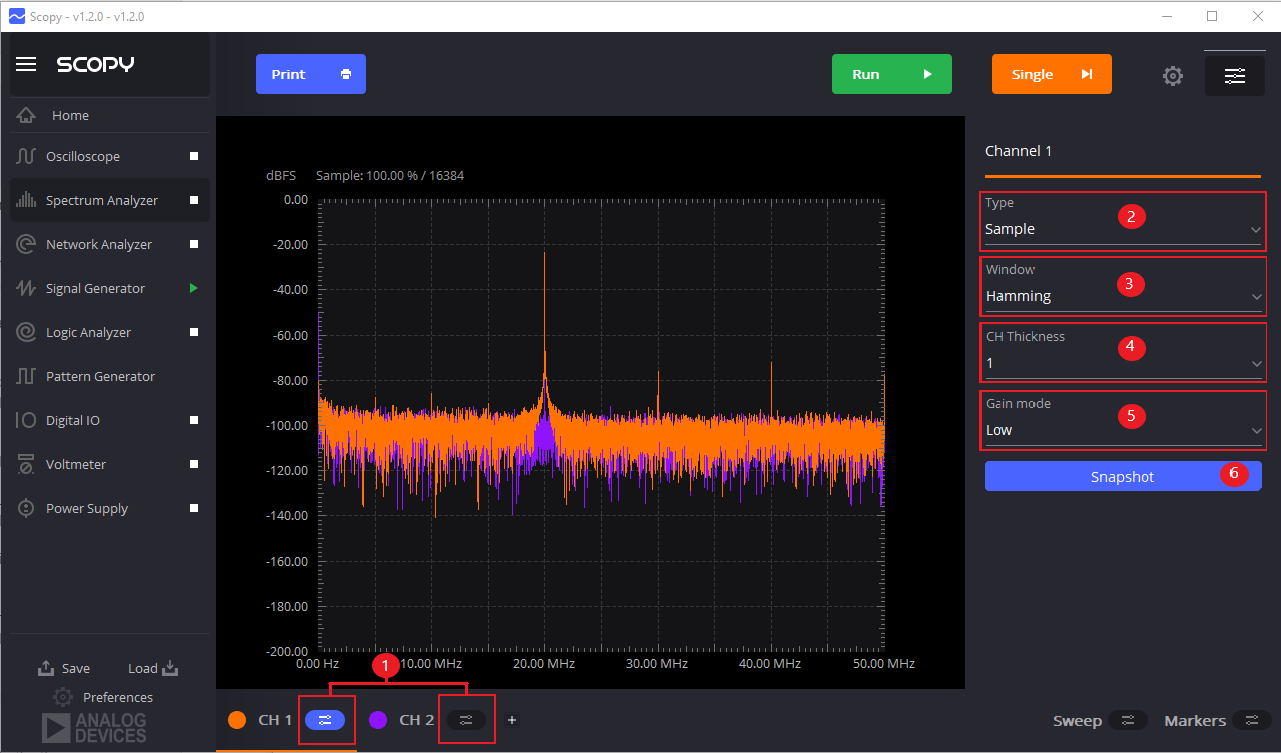
The channel setting allows the user to set the desired computation or variations on the signal that wants to be analyzed. The proper FFT computation and the type of averaging desired to use is set here.
Channel menu button: This button will bring out the channel settings either for channel 1 or 2.
Type: The options available in the drop down menu are the several types of averaging available in Scopy’s Spectrum Analyzer. This will improve the accuracy and repeatability of measurements. The summary of the averaging types are written below.
Window: Determines the type of FFT computation to be used.
CH Thickness : Sets the desired thickness for each plot signal.
Gain mode: Change the gain mode for each channel. Available options are “Low” (-25V to 25V) and “High” (-2.5V to 2.5V).
Snapshot button: Create a snapshot of the current channel and add it as a reference channel (see screenshot attached below).
Here’s a brief suggestion of the window functions based on the input signal:
Signal Content |
Window |
|---|---|
Sinewave or combination of sinewaves |
Hann |
Sinewave where amplitude accuracy is important |
Flat top |
Narrowband random signal (vibration data) |
Hann |
Sinewave or combination of sinewaves |
Hann |
For the description of the Window Function see below:
Hanning: The most commonly used window. It has an amplitude variation about 1.5dB for signals between bins and provides reasonable selectivity. Its filter roll off is not particularly steep. Hanning windows can limit the performance of the analyzer when looking at signals close together in frequency with very different amplitude.
Flattop: The Flattop window improves on the amplitude accuracy of the Hanning window. Its between-bin amplitude variation is about 0.02 dB. However, the selectivity is a little worse. Unlike the Hanning, the Flattop window has a wide pass band and very steep rolloff on either side. Thus, signals appear wide but do not leak across the whole spectrum.
Blackman-Harris: The Blackman-Harris window is a very good window to use with FFT analyzers. It has better amplitude accuracy than the Hanning, very good selectivity, and the fastest filter rolloff. The filter is steep and narrow and reaches a lower attenuation than the other windows. This allows signals close together in frequency to be distinguished, even when their amplitudes are very different.
Kaiser : The Kaiser window, combines excellent selectivity and reasonable accuracy. The Kaiser window has the lowest side-lobes and the least broadening for non-bin frequencies. Because of these properties, it is the best window to use for measurements requiring a large dynamic range.
Visit this for a detailed explanation
For the description of the Averaging Types see below:
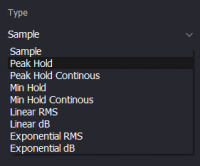
RMS Averaging: Reduces fluctuations in the data but does not reduce the actual noise floor. With a sufficient number of averages, a very good approximation of the actual random noise floor can be displayed. RMS averaging involves magnitudes only and has no phase information.
RMS Linear Averaging: n samples all added together then divided by n.
RMS Exponential Averaging: 1/nth of current magnitude, added together with n-1 of previous magnitude.
Peak hold: The new spectral magnitudes are compared to the previous data, and if the new data is larger, the new data is stored. The resulting display shows the peak magnitudes which occurred in the previous group of spectra.
Peak hold continuous: Similar with the peak and hold averaging except it looks at the number of instantaneous spectra recorded until measurement is restarted.
Min hold: The new spectral magnitudes are compared to the previous data, and if the new data is lower, the new data is stored. The resulting display shows the peak magnitudes which occurred in the previous group of spectra.
Min hold continuous: Similar with the Min hold averaging except it looks at the number of instantaneous spectra recorded until measurement is restarted.
Averaging
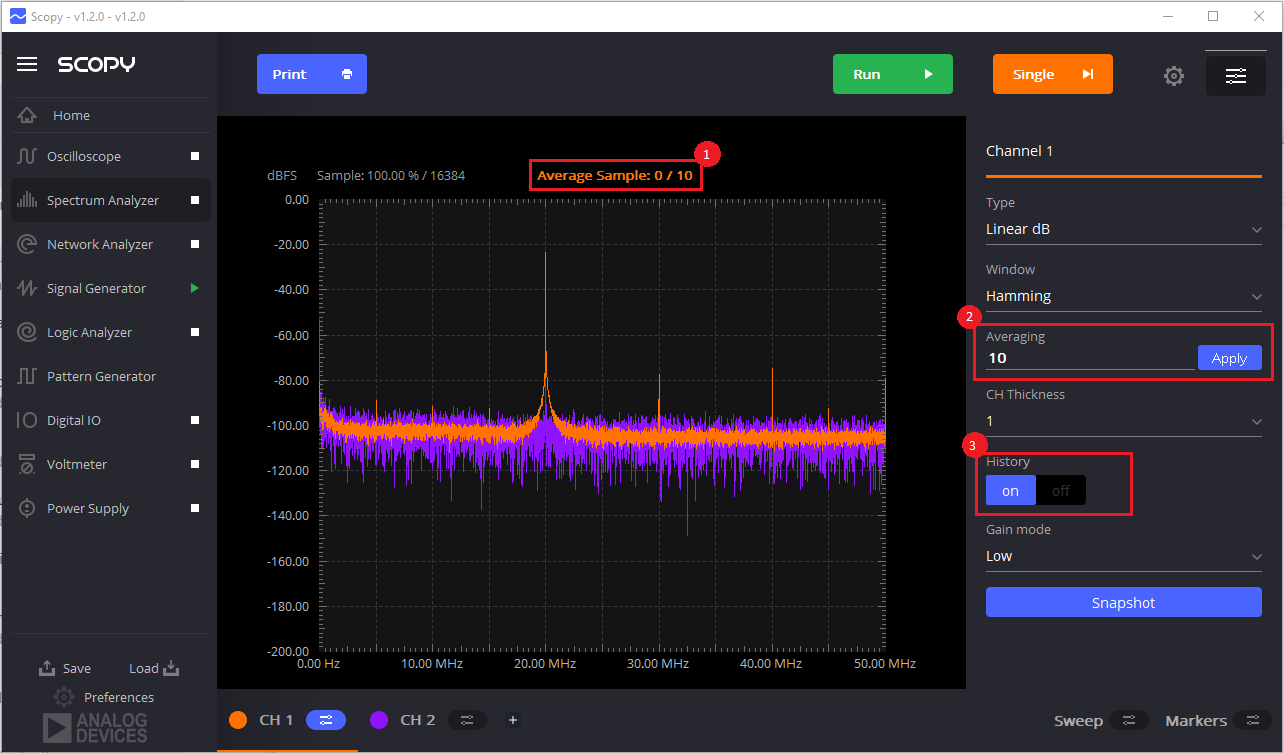
Averaging status: Display how many samples were processed from the maximum set averaging amount.
Averaging: Sets the desired amount of averaging.
History button: Turn average history on/off (this affects the way the average is being processed and it is available only for the following average types: Linear RMS and Linear DB).
The average value can be set to maximum 1000 for the following average types: Peak Hold, Min Hold, Linear RMS and Linear DB. The average value can be set to maximum 1000000 for the following average types: Peak Hold Continuous, Min Hold Continuous, Exponential RMS, Exponential DB. For Linear RMS and Linear DB the maximum average value is influenced by the History button. If the History button is ON, the maximum value is 1000. If the History button is OFF, the maximum value is 1000000.
Snapshot
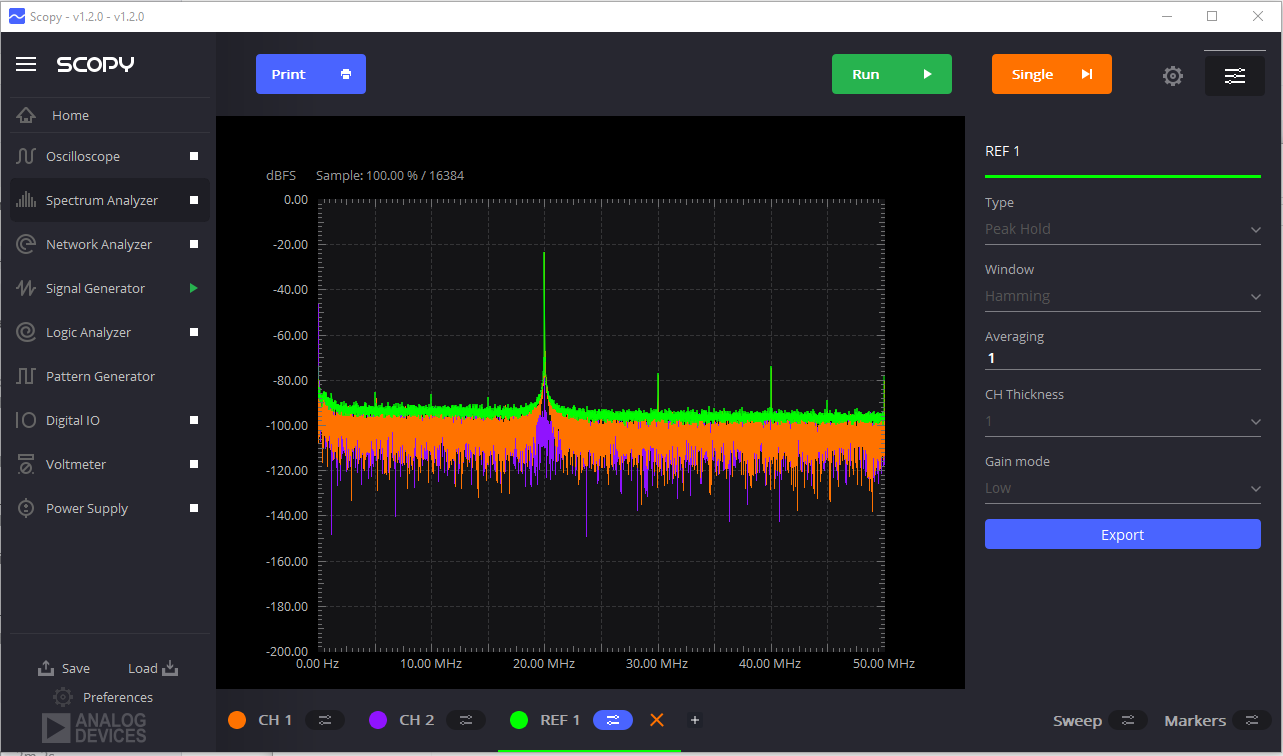
General Settings
General settings contains the export data button.
Sweep Setting
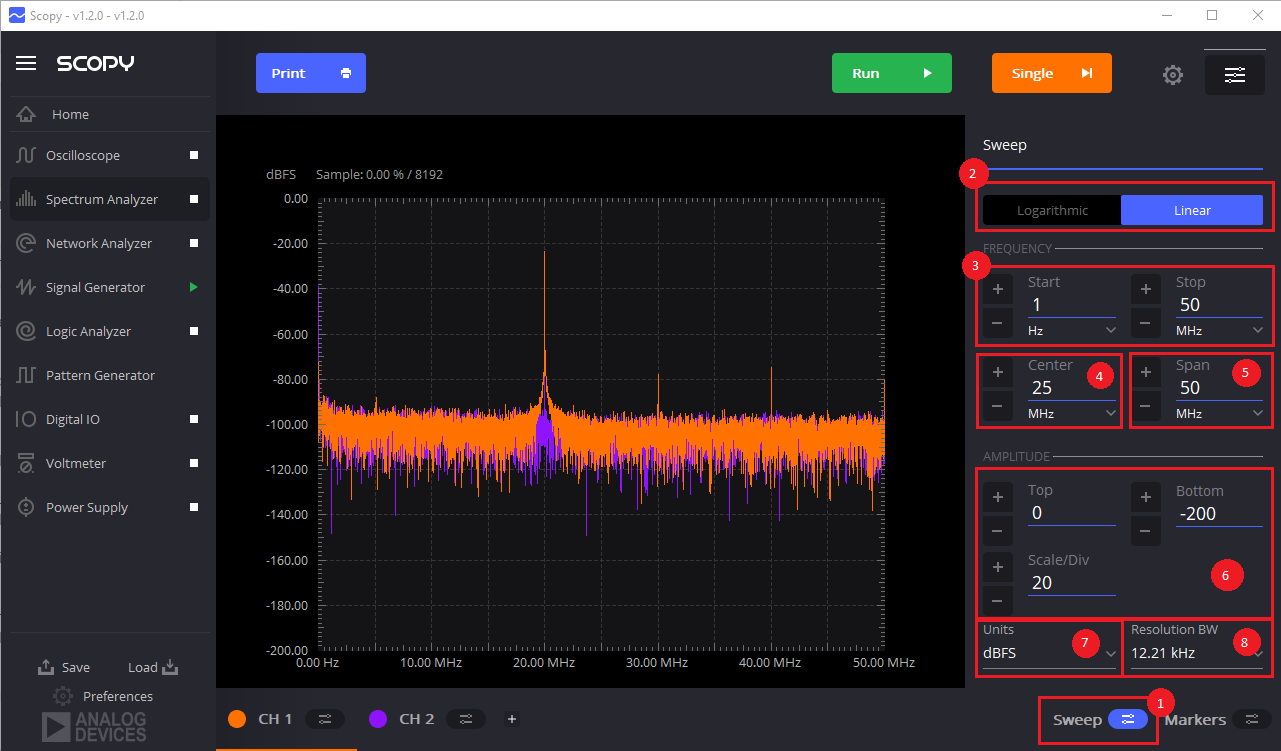
Sweep menu allows the user to make changes on the Spectrum Analyzer’s signal plot window depending on the desired frequency to be analyzed. All the changes made applies to both channels.
Sweep menu button: This button will bring out the sweep setting.
Logarithmic/Linear frequency switch: Change the frequency displayed on the plot between linear and logarithmic.
Start and Stop Frequency: Sets the start and stop frequency to be analyzed from 0Hz to 50MHz.
Center Frequency: Sets the center frequency to be analyzed.
Span: Sets the spectrum span to be analyzed from 0 Hz to 50MHz.
Top, bottom, scale/division -amplitude controls: Sets the amplitude range to be analyzed.
Units: Sets the amplitude unit to _dBFS, dBu, dBV, Vpeak, Vrms and V/√Hz.
Resolution Bandwidth: Sets the frequency delta between two spectrum points.
Markers
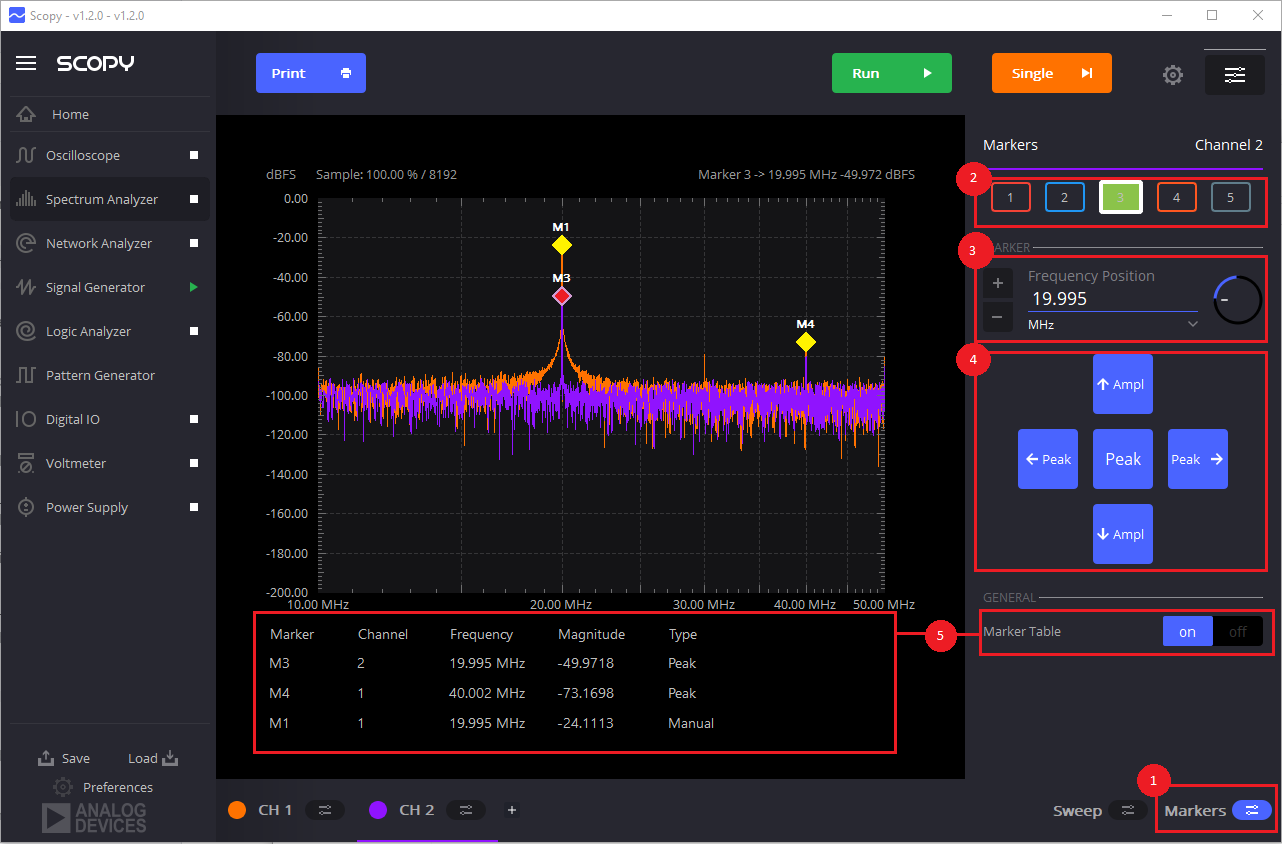
Markers allow the user to measure the amplitude on a specific frequency. Scopy allows the user to have multiple markers on each channel. The marker controls makes it flexible enough for quick spectrum measurement.
Marker Settings : This button will bring out the Marker Settings.
Marker Enable button : Enable/Disable button of the markers. The marker is turned on when the box is filled with colors. Scopy allows 5 markers to be turned on at the same time.
Marker Control: Allows the user to move the marker on a specified frequency position.
Automatic Marker Control: These buttons automatically positions the selected marker based on their function.
Peak: Places the marker at the highest peak on the display.
← Peak / → peak: Moves the marker to the left/right peak in the signal.
Dn Ampl: Moves the marker to the next lower amplitude in the signal.
Up Ampl: Moves the marker to the next higher amplitude in the signal.
Marker Table: The function enables the marker table for a better view of the spectrum frequency. The marker table enables the user to identify the marker position on each channel especially when both are active. It lists down the marker number, the channel it currently measures, frequency, magnitude and the marker type.
Warning
For additional marker control. Each markers may be moved by dragging it on the Signal plot window.