Logic Analyzer
Video guide:
General
To switch to this instrument click on the Logic Analyzer button from the left menu.
This instrument can capture only in single mode by pressing the Single button.
The logic analyzer instrument consists of a menu containing settings for the acquisition, a channel enumerator, decoder enumerator, export settings and another menu for the current selected channel
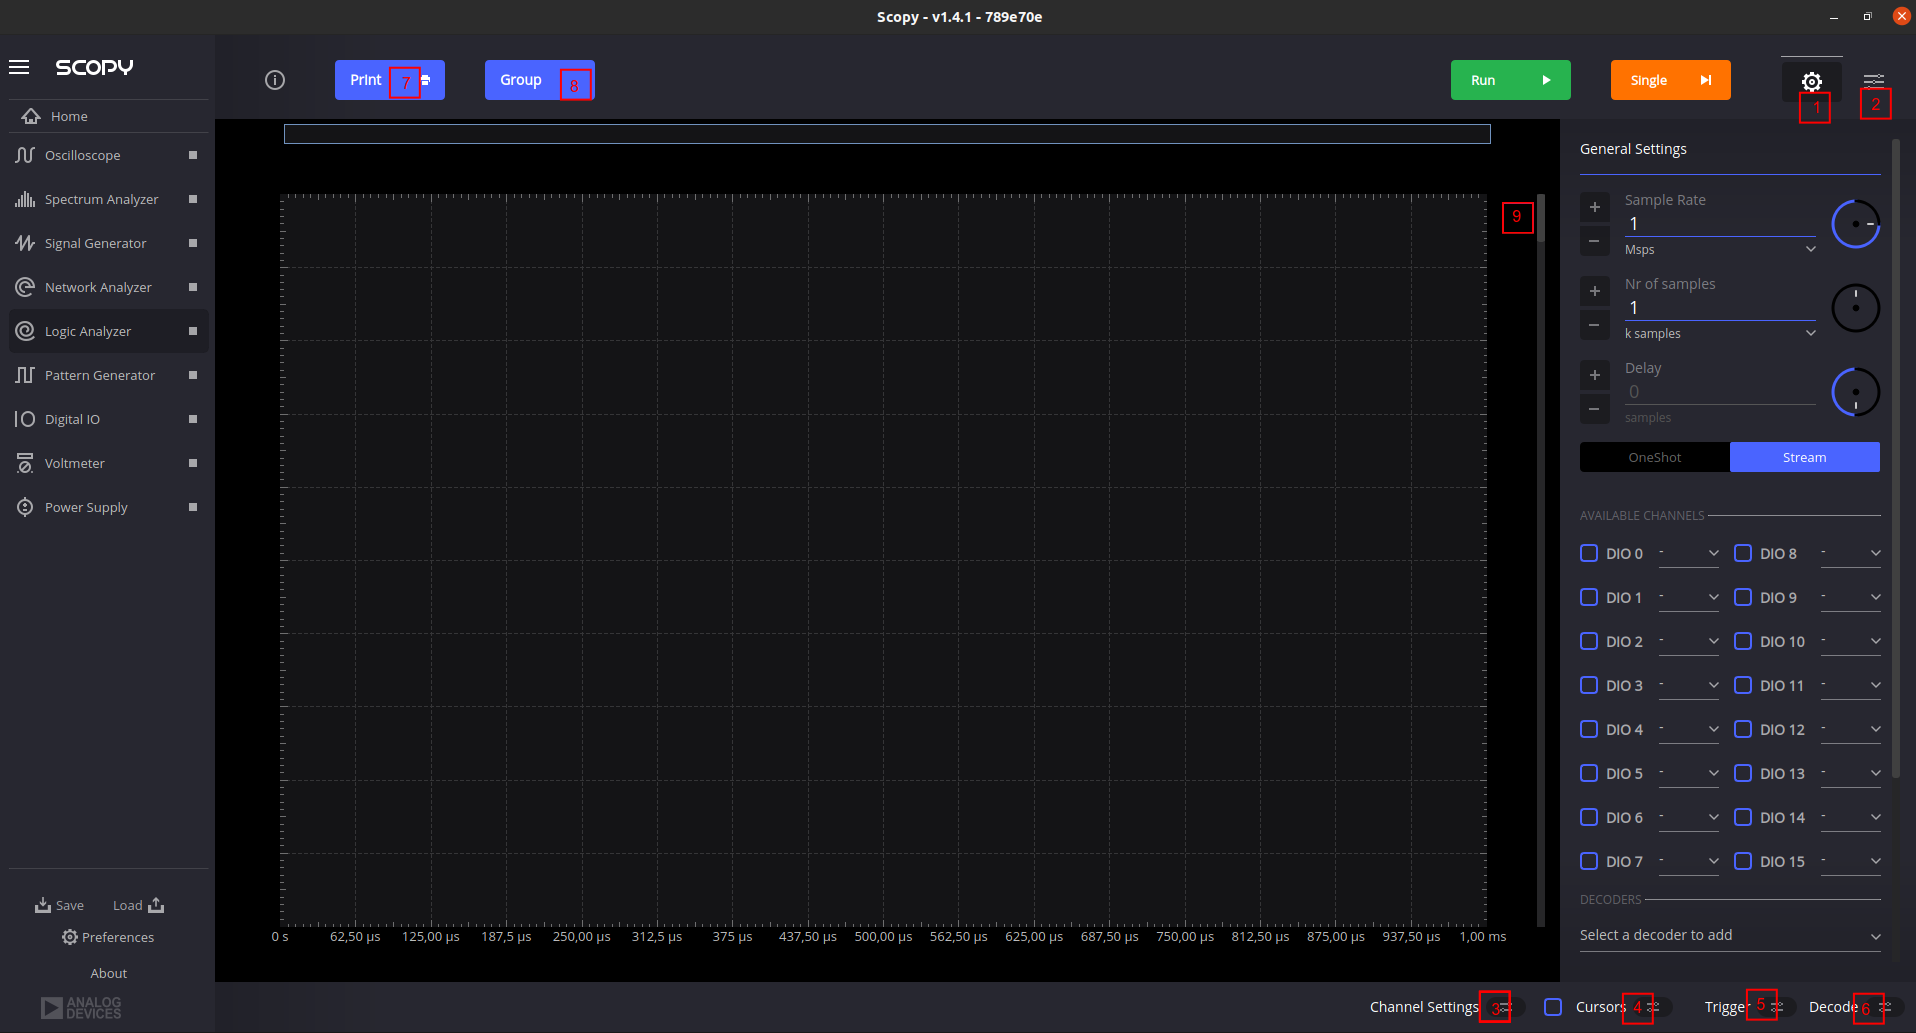
1.General Settings menu
2.Last opened menu
3.Channel Settings menu
4.Cursors menu
5.Trigger menu
6.Decoder Table button
7.Print button
8.Group button
9.Scroll plot handle
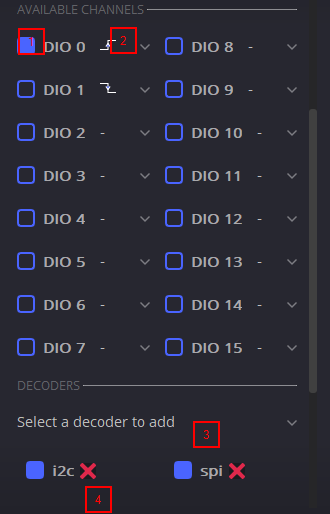
Channel & Decoder Manager
Enable channel: By toggling the checkbox the channel will or will not be visible on the plot
Select a trigger configuration for the channel: The dropdown will allow to select a trigger for the channel or none
Add a new decoder: Select a decoder from a list. The selected decoder will be visible in the decoder enumerator
Remove decoder: Allows removing of a decoder
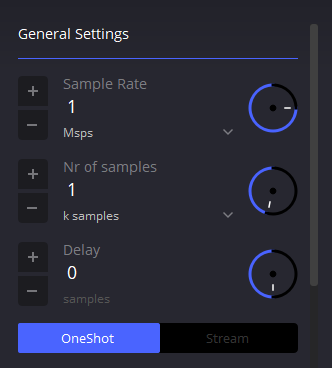
General settings
Sample Rate: This spinbox will allow setting the sample rate of the Logic Analyzer
Number of Samples: This spinbox will allow setting how many samples the Logic Analyzer will capture
Delay: This spinbox will set the time trigger delay
OneShot/Stream: select either we wait for the whole set of samples to be captured, or capture sequentially smaller chunks and plot them
Export
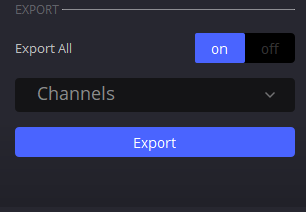
The Logic Analyzer can export current data in .csv (Comma-separated values) and .vcd (Value change dump) format. Using the “Export All” switch you can select and export data from all the available channels or you can create a custom selection using the dropdown. After deciding which channels should be exported, click “Export” and choose a file. The exported .csv files are compatible with instruments throughout the application, so you could load the file in the Pattern Generator.
Channel settings
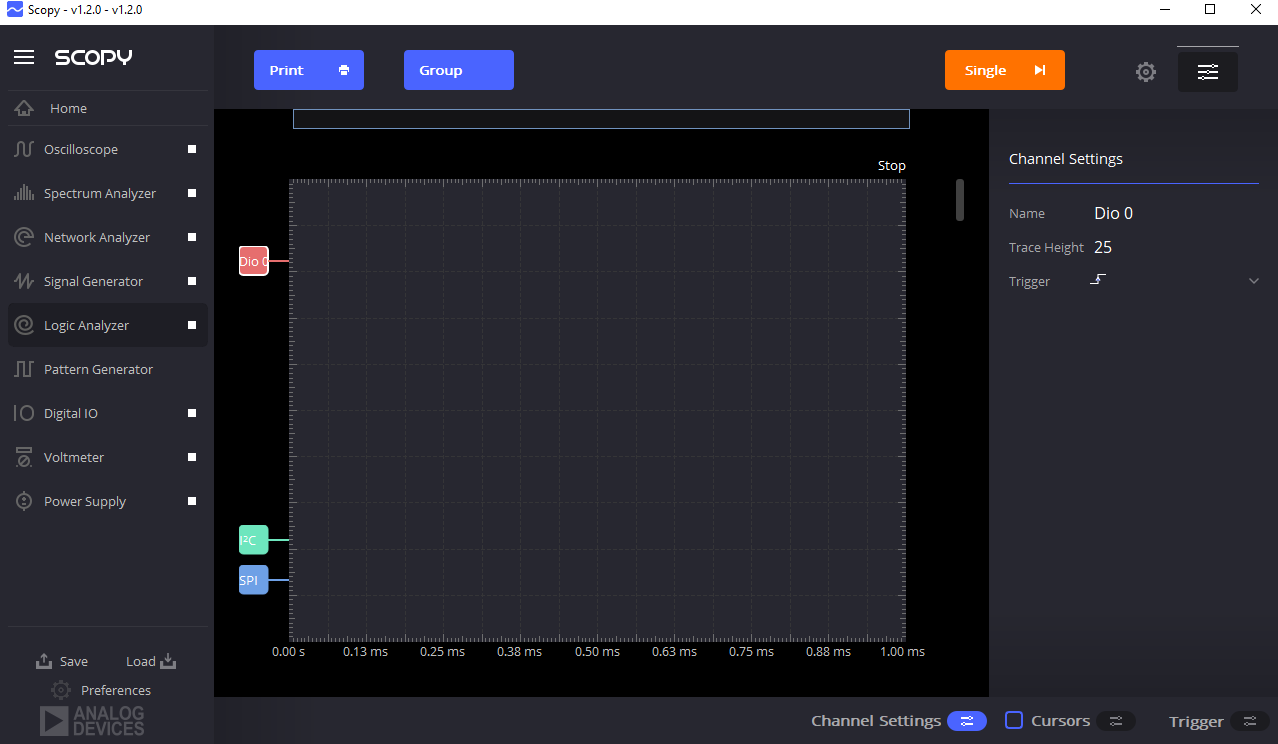
To view the channel selected settings select from the bottom menu the “Channel Settings”. In order to select a channel the handle of the channel should be “double clicked”. In this menu the name of the channel can be changed. The assigned trigger option for it can be modified and we can also play with the trace height which is in pixels to better see or fit the signal on the plot
Decoder settings
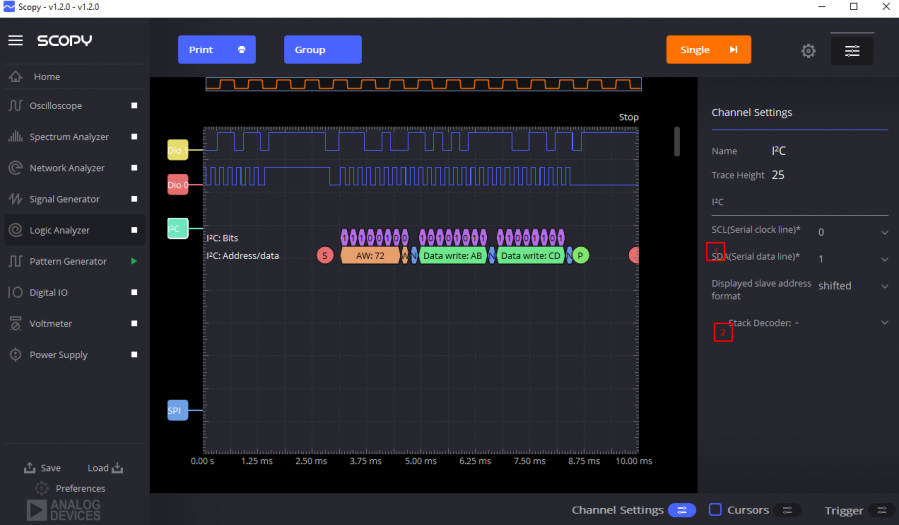
After adding a decoder from the general menu we can view it by selecting it on the plot and going to the channel settings menuScopy Logic Analyzer
The channels from which the decoder will decode data need to be assigned here. The channels that are required are marked with an asterix(*)
On top of a decoder we can stack another one by selecting from a list of compatible decoder
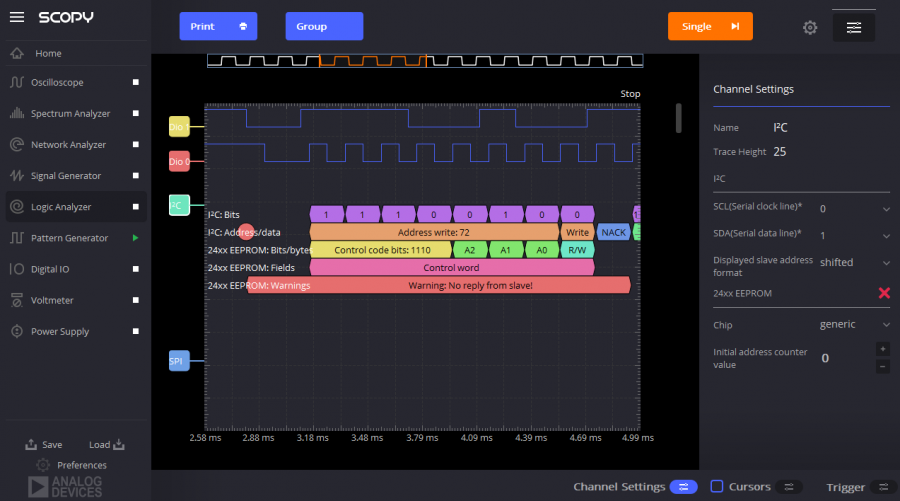
A stacked decoder can be removed by selecting the x button next to the name of it. There is no limit to stacking decoders, only that one decoders output is the next ones input and some decoders might not send further data.
Grouping Channels and Decoders
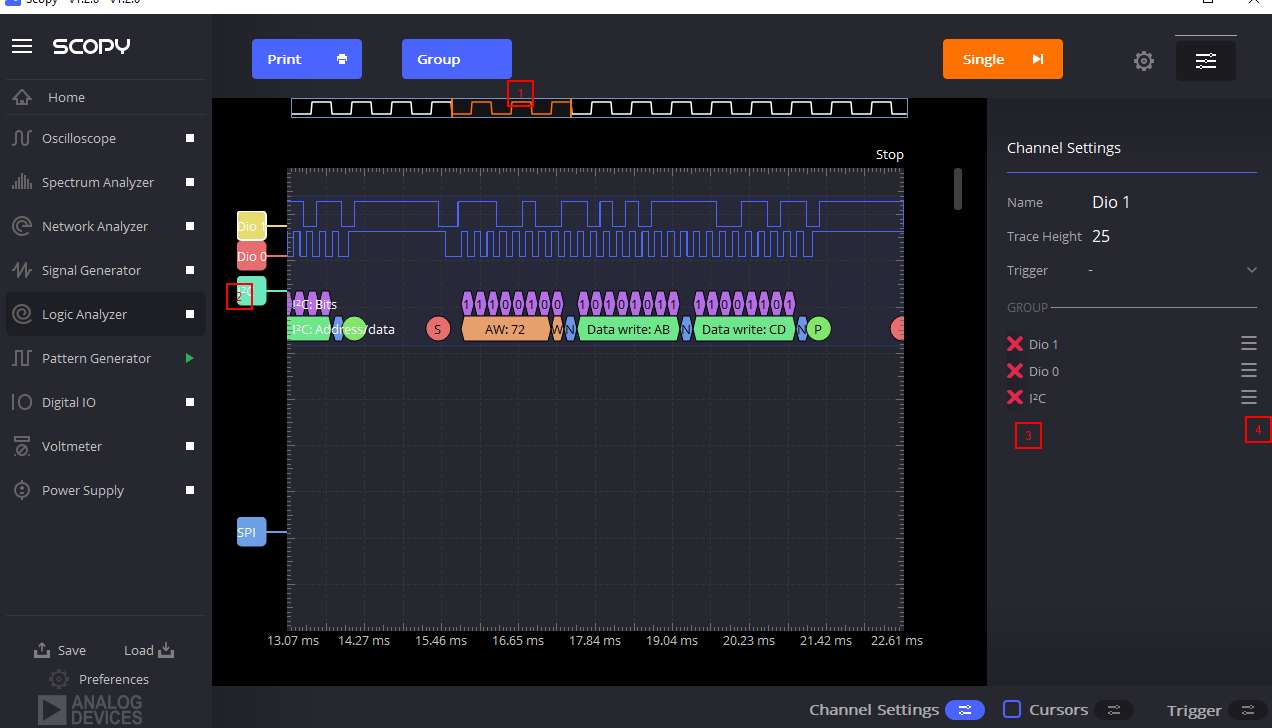
The group button when enabled will allow to select multiple channels from the handles area (the group button when enabled will become a done button that when clicked will create a group with the selected channels)
When grouping channels together select all the channels that you want to be part of a new group from the handles area (Selecting a channel is done by double clicking the handle of the channel on the left side of the plot).
Channels can be removed from the group by pressing the red “X” button
The channels can be moved around in the group (changed order) by using the move icon
Decoder Table
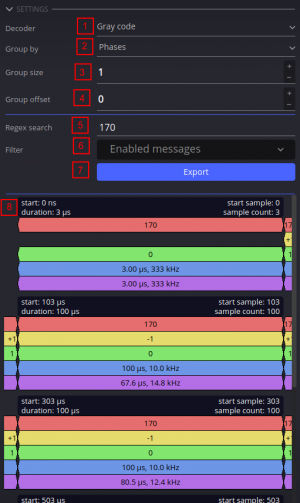
Select decoder
Select the leading message type for grouping
Set group size
Offset groups by annotations amount
Case insensitive regex search (press Enter to start searching)
Filter annotation types
Export all visible data in 2 formats:
- 7.1. .txt groups data per annotation applying table filter (like
pulseview’s decoder export)
7.2. .csv groups data per sample applying table filter and search
Group info can be enabled/disabled in preferences
Use Cases
Prerequisites
Connect ADALM2000 to your computer via USB.
Start Scopy and connect to the device.
From the left menu, choose the Logic Analyzer.
Enable & run multiple channels
Enable 8 channels using the channel manager located in the left side of the plot. To disable a channel use its blue checkbox.
To acquire 200 ms of data, change the sample rate to 100 ksps, and the number of samples to capture to 20k samples.
Start the acquisition using the “Single” button. After 200ms you should see 8 signals on the plot.
Interaction with Scopy Pattern Generator
From the left menu, choose the Pattern Generator tool.
Select channel 0 and 1 and create a group.
Select the group and set the pattern to i2c. Set the following parameters:
3.1. frequency: 5khz
3.2. data: “abcd”.
Start the Pattern Generator using the top right button.
In the Logic Analyzer add a i2c decoder
Select this decoder and set the SCL channel to 0 and SDA to 1
In the general settings set the sample rate to 1Msps and the acquired number of samples to 50k samples
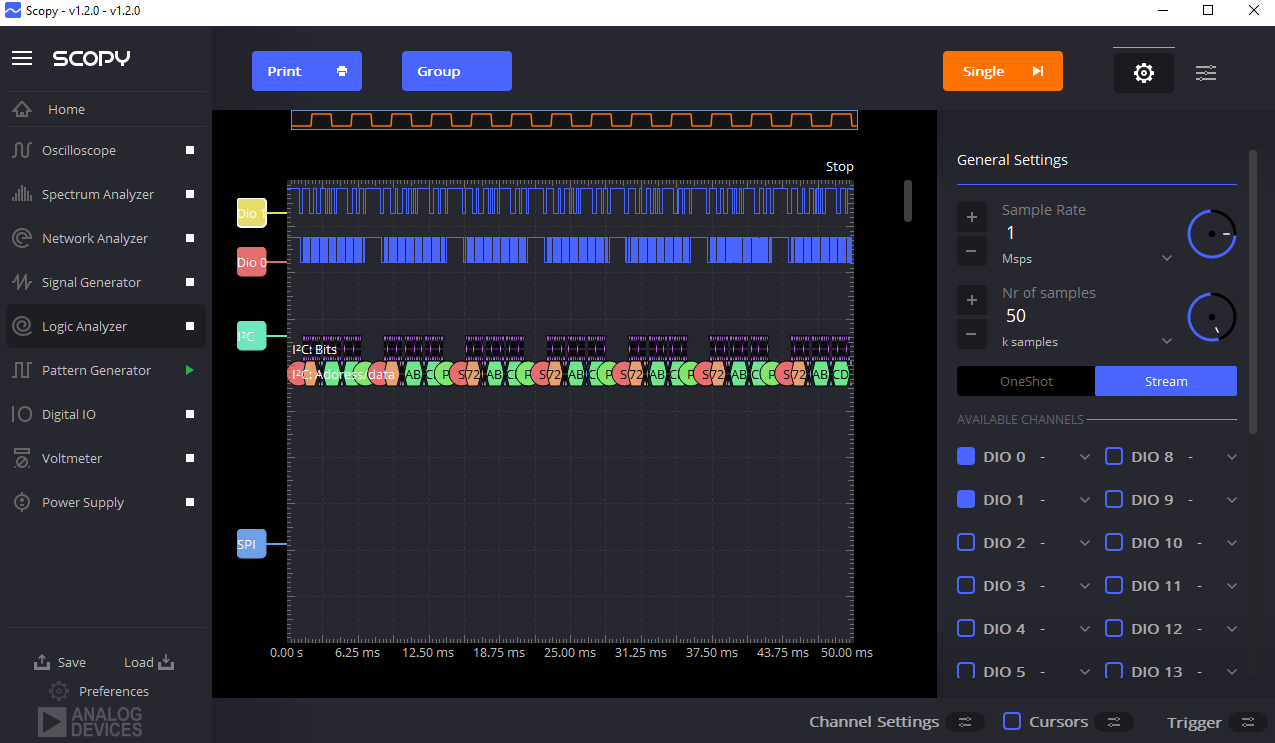
To zoom in click and select a region of interest. To zoom out right click should be used
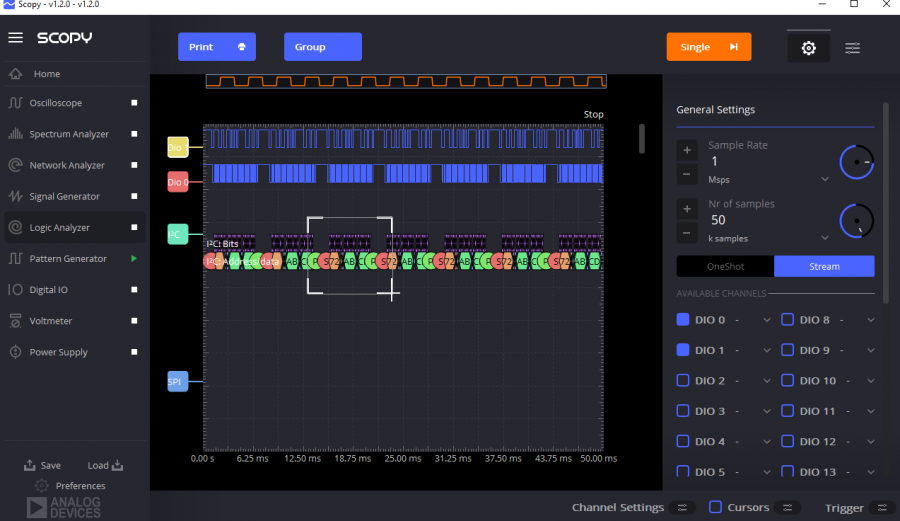
Now the decoded data should be more visible
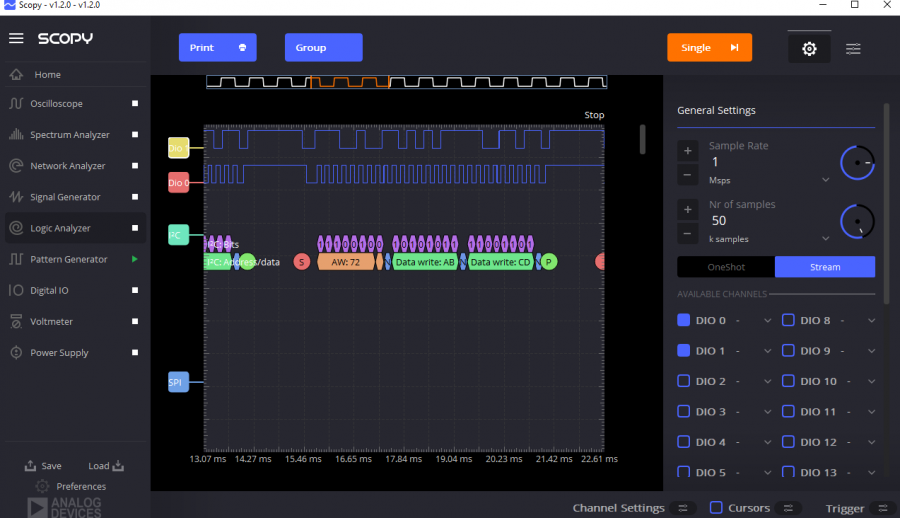
To enable the cursors toggle the checkbox in the bottom menu
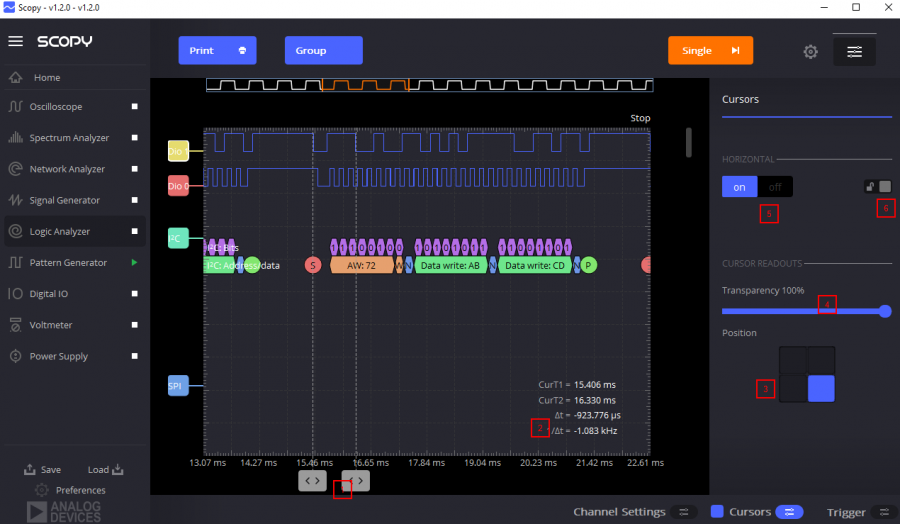
Move the handles to the desired position
Cursor readouts
Change the position of the readouts on the plot
Change the transparency of the readouts
Toggle the cursors visible
Lock the cursors (moving one cursor will move the other one to keep the set distance between them)
