Network Analyzer
Video guide:
Introduction
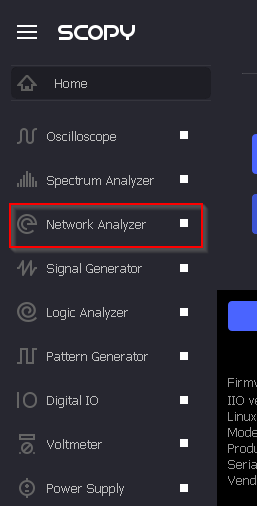
For you to switch to this instrument, click on the “Network Analyzer” from the menu list as illustrated. The small white squares allows you to run/stop the instrument without having that instrument in the current display.
Front Panel
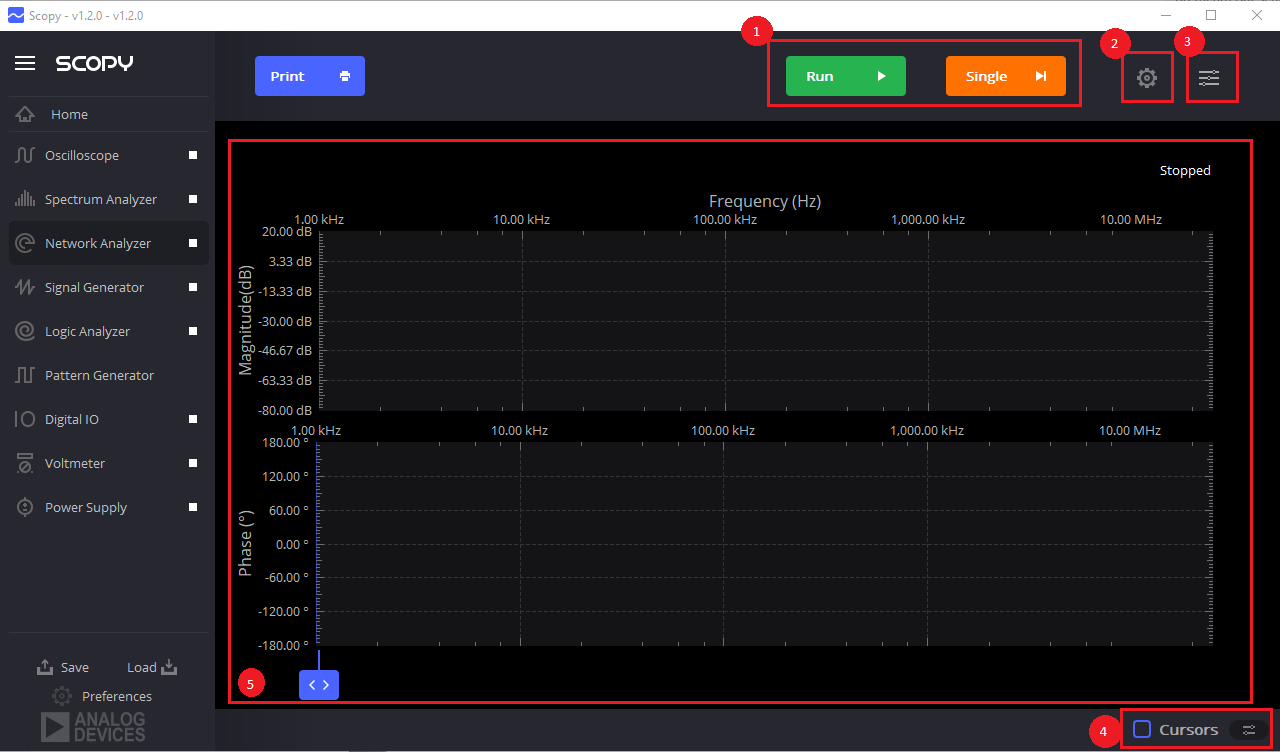
1. Run/Stop and Single Buttons
Starts and stops the capture of Network Analyzer Instrument. Alternatively, the capture can be started and stopped by clicking on the small white square at the right of the instrument on the left side menu.
2. Settings Menu Button
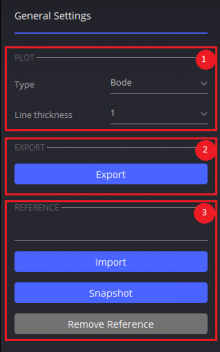
Shows or hides the general settings menu.
2.1. Reference Channel
Sets the reference channel for the network analyzer from the oscilloscope probes 1+ and 2+ to act as the phase reference.
2.2. Waveform Settings
Allows the user to change the amplitude, offset and settling time of the generated signal. The amplitude can be set to any value within the range of 1uV to 10 V. The offset value can be changes from -5 V to 5 V.
2.3. Response Settings
DC Filtering
Gain Mode – Sets the gain mode: can be Automatic, High and Low.
Settling time
2.4. Sweep Settings
Linear/Logarithmic switch – Sets the type of scale for the frequency axis.
Start/stop frequency – Sets the minimum and Maximum Frequency to be displayed in the Bode plot. The minimum frequency ranges from 1 mHz to 20kHz and the maximum frequency ranges from 1mHz to 20MHz.
Samples/decade and total samples count
Periods - The minimum number of periods to be acquired.
Average - Set the number of averages to be applied.
2.5. Display Settings
Allows you to adjust the view of the displays whether in Bode, Nyquist, or Nichols plot. By default, as you switch to this instrument, the minimum/maximum magnitude is set to -90 dB/10dB, but this can be set to any value within the range of -120 dB to 120 dB. The minimum/maximum phase value is set to -180/180 degrees by default but this can be changed to any value within -180 to 180 degrees. You can adjust these values before, during or after you click run. This is for viewing the plot effectively.
2.6. Buffer Previewer
Allows you to view the acquired buffers in a time domain plot. The menu contains a switch used to turn ON/OFF the buffer previewer and a button which opens the current buffer in the Oscilloscope tool.
Buffer Previewer
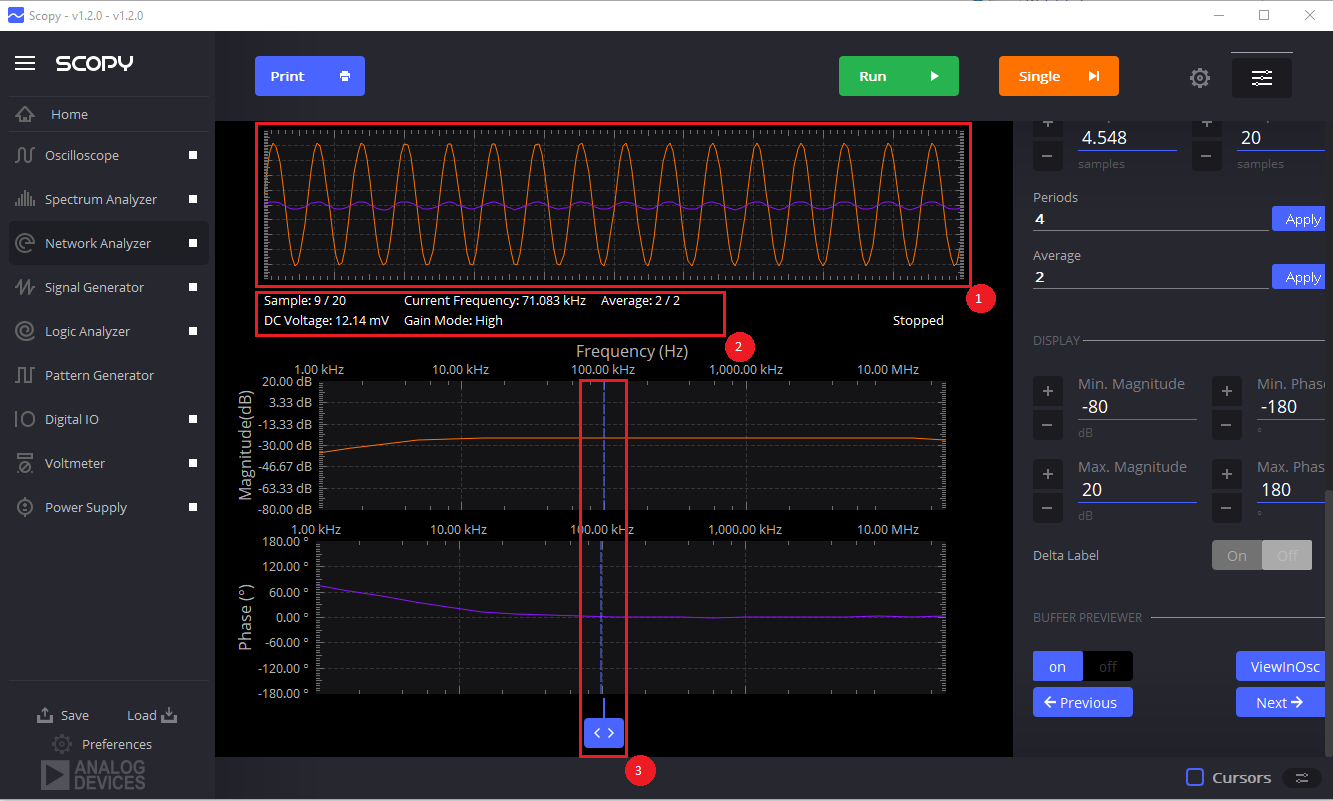
1. Buffer previewer plot
2. Acquisition status
Sample - Index of the selected buffer.
Current frequency
Average - The number of acquired buffers and the total number of buffers used for averaging.
DC Voltage
Gain Mode
3. Buffer selector - Select the buffer that will be displayed in the buffer previewer.
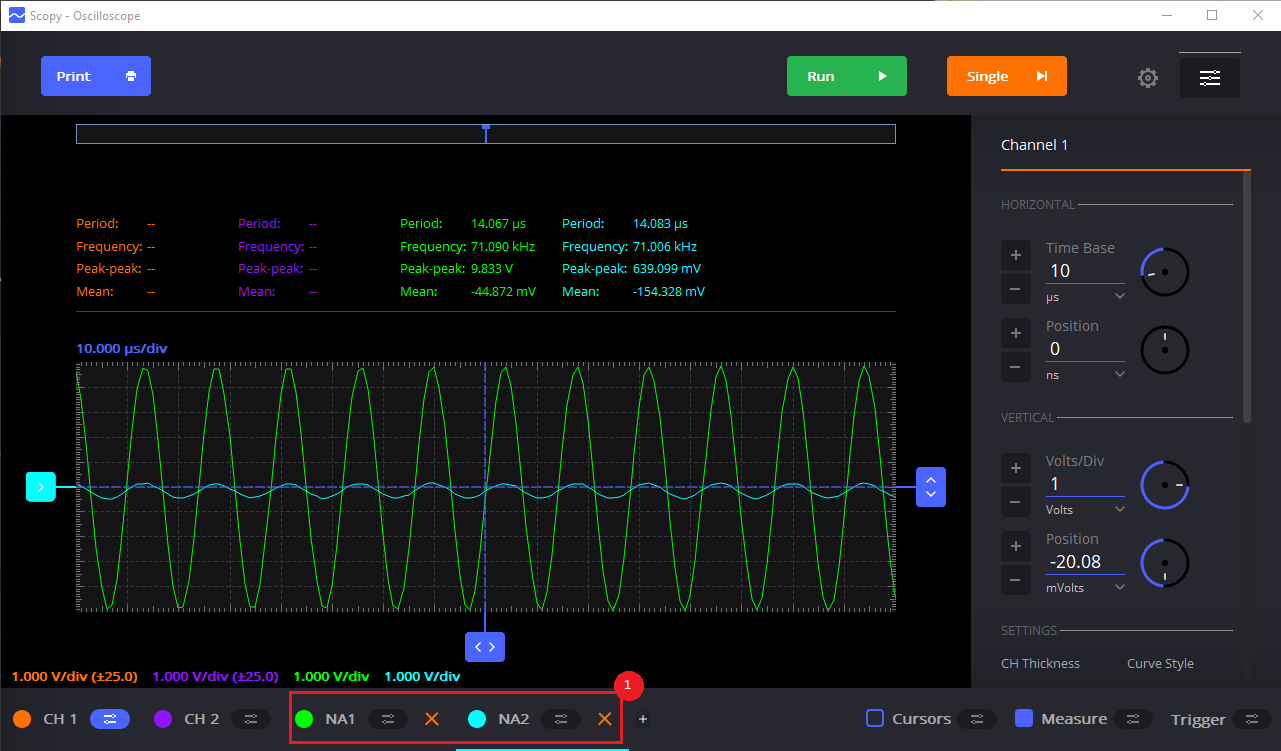
The “View in Osc” button will open the Oscilloscope tool and load the channels exported from the Network Analyzer tool.
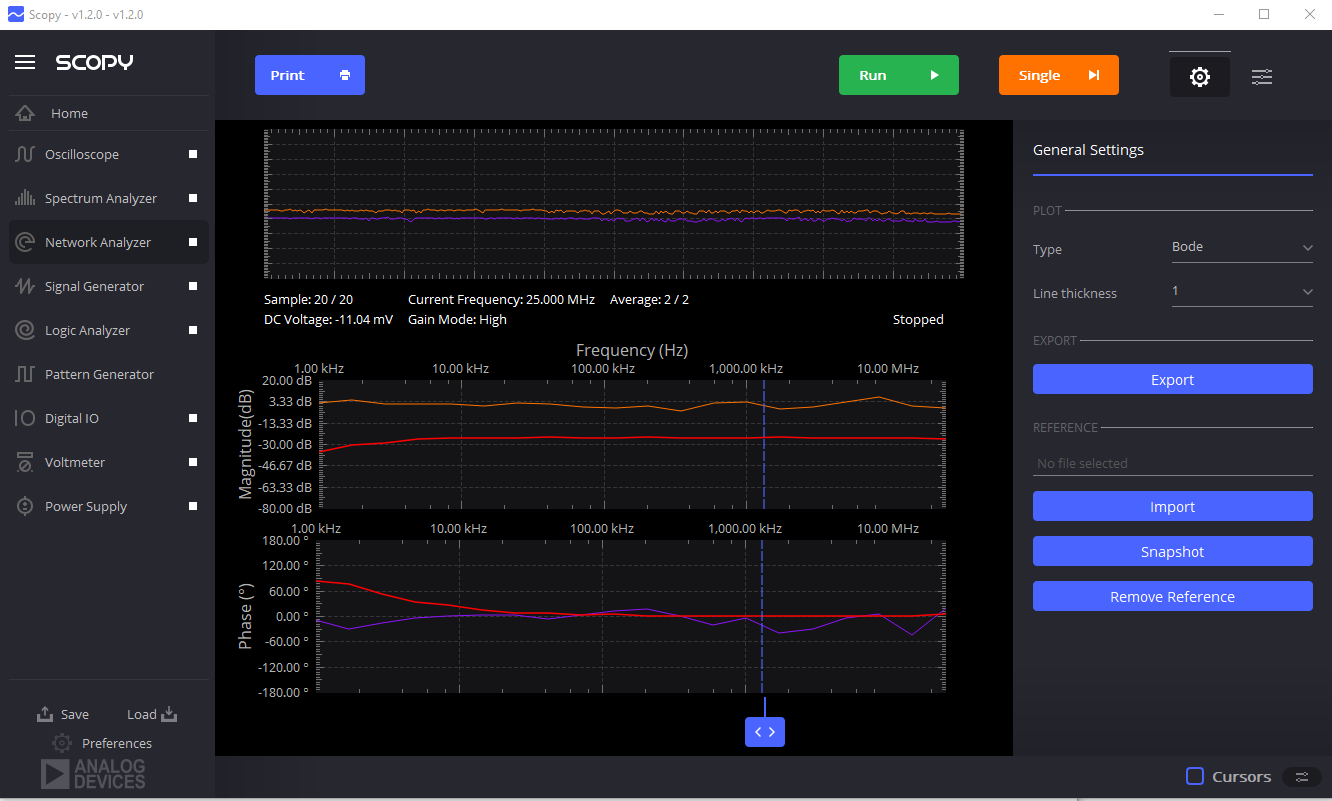
Snapshot
Plots
Bode Plot
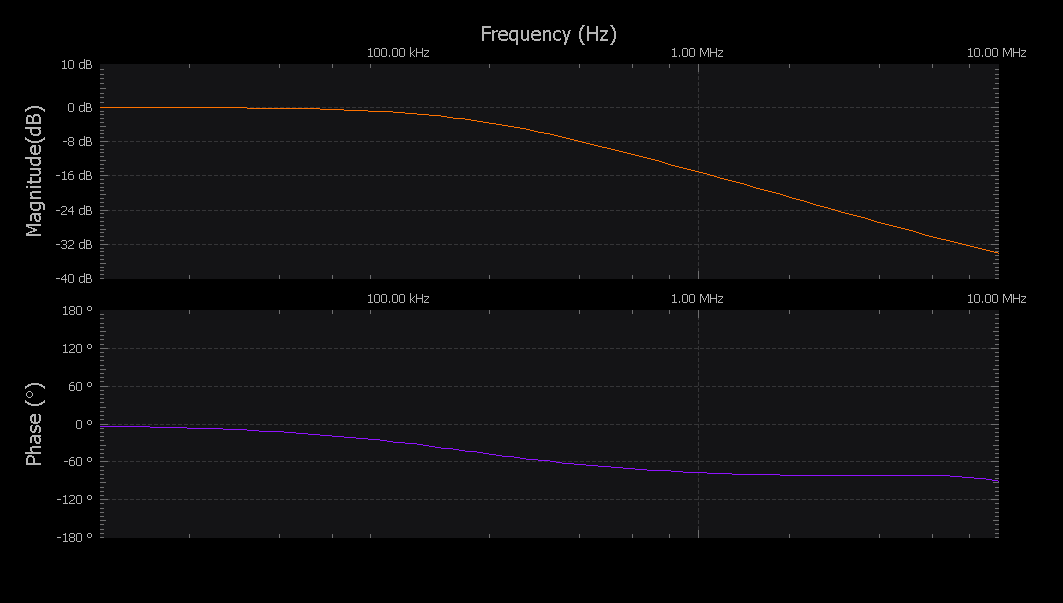
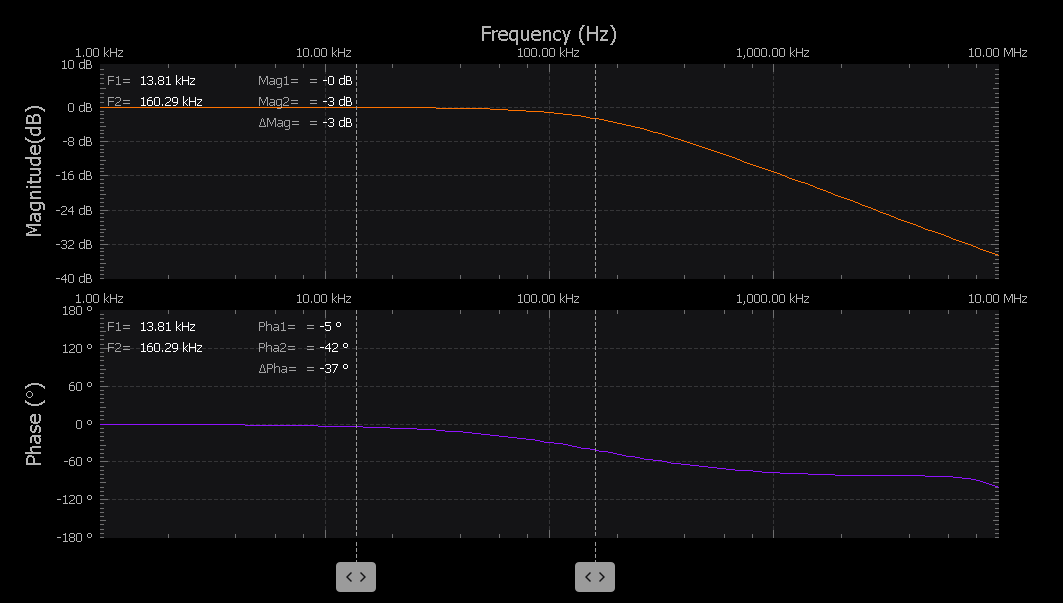
Bode Plot shows the Frequency response of a system in two parts, one part is the Bode magnitude plot that contains magnitude expressed in dB across the frequencies set from the control menu and the Bode phase plot expressing the phase shift.
Bode plot display may be modified from the available configurations in Frequency Sweep Settings and Display Settings from the Control menu.
Zooming the display
After capturing the signal, the graph may be zoomed in on the desired location by holding and dragging on the minimum and maximum desired of the frequency like shown below. This will zoom in both the Bode magnitude plot and Bode phase plot. To zoom in or out on magnitude or phase, use display controls from settings panel.
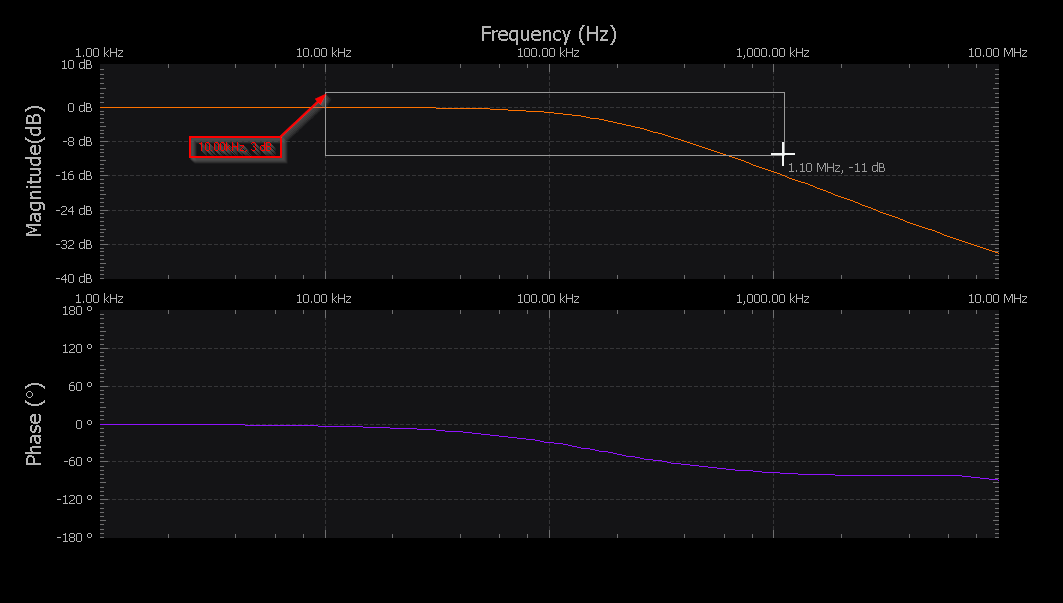
The default view that is set from the control menu may be returned by clicking the right-mouse button.
Nyquist Plot
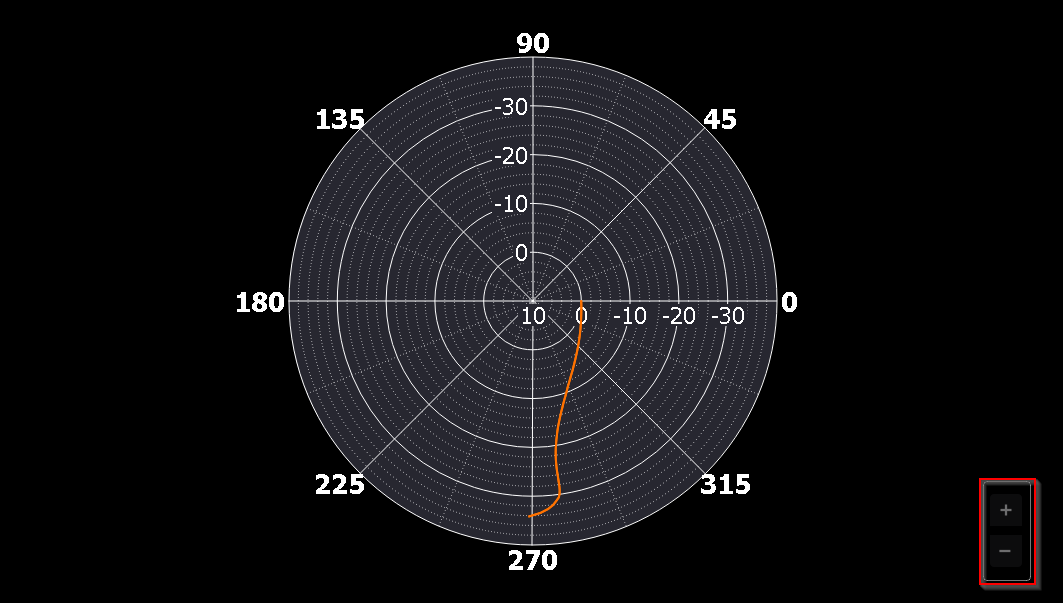
Scopy network analyzer also features another way of showing the frequency response of a system, it is through the Nyquist diagram. Nyquist diagram is a polar plot of the frequency response that displays the amplitude in dB and phase angle on a single plot to determine if the system is stable or unstable. Display Settings control the Nyquist diagram by adjusting the minimum and maximum magnitude to the desired value.
To zoom in or out, you can use the + and - buttons (See above image). When zoomed in, you can hold left click and drag the plot around.
Nichols Plot
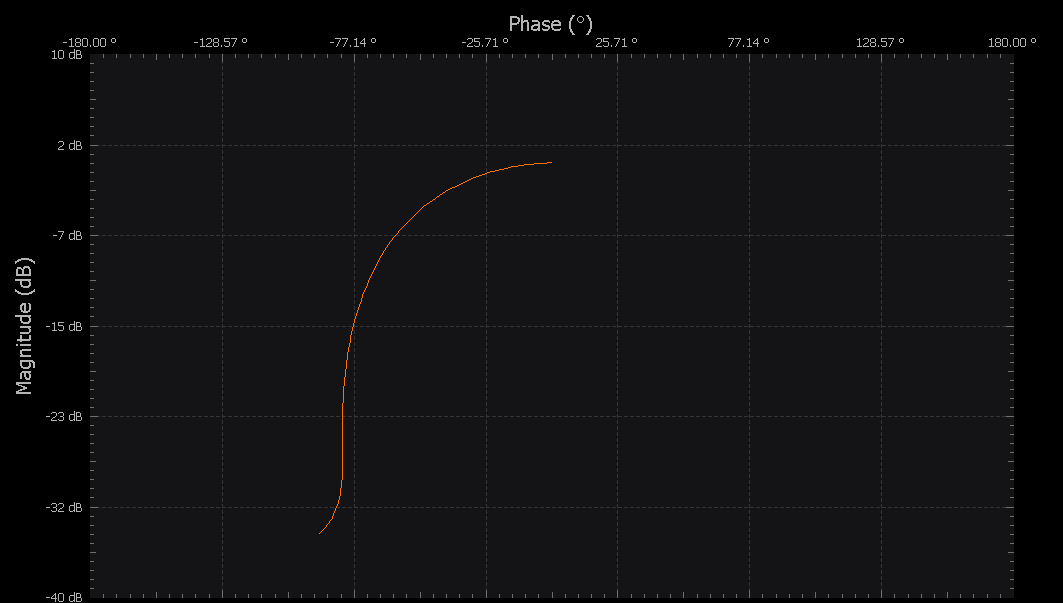
Nichols plot is another method of picturing frequency responses of systems. As you can see in the illustration, the Nichols plot shows the gain magnitude on a logarithmic scale (dB) in the y-axis and the phase on linear scale (degrees) in the x-axis. You can determine the gain and phase margins graphically and easily using this plot. The gain margin can be graphically determined by getting the absolute value of the magnitude axis intersect. The phase margin is determined by the distance between the origin and the phase axis intersect. The settings you applied to the controls when plotting either in bode or Nyquist will also reflect in the Nichols plot.
Network Analyzer - Low Pass Filter Example
The following example we will show how to use the Network Analyzer to obtain the frequency response of a low pass filter circuit. When ever using the network analyzer, you need a stimulus/reference channel (always waveform output channel 1 and oscilloscope channel 1) and a measurement channel (always oscilloscope channel 2).
Consider the circuit in the figure below:
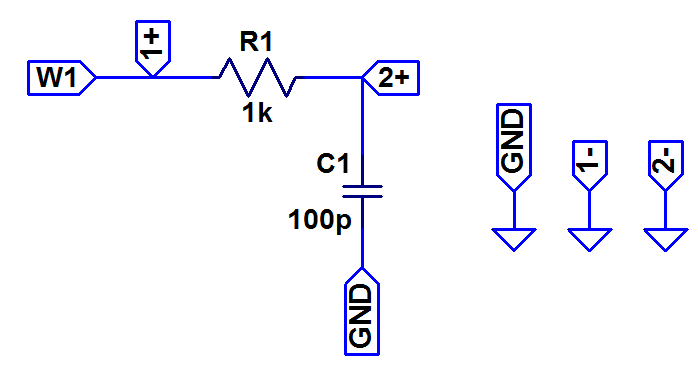
To characterize the filter we need an input/stimulus, and way to measure the response,
the reference channel:
the stimulus : Waveform Generator channel 1 (‘W1’)
the reference channel measurement: Oscilloscope Positive Channel 1 (‘+1’)
the response channel:
the output of the filter : Oscilloscope Positive Channel 2 (‘+2’)
Since everything in this example is ground referenced, the oscilloscope negative input channels are connected to ground.
Breadboard connections for such a circuit are displayed below:
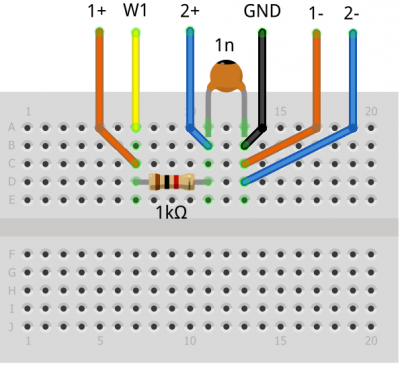
In the Network Analyzer interface, set the Reference: Channel 1 and the frequency range: Min Freq 1kHz and Max Freq 10MHz.
Run the instrument. The resulted plot is the frequency response of the low pass filter for the component values chosen.
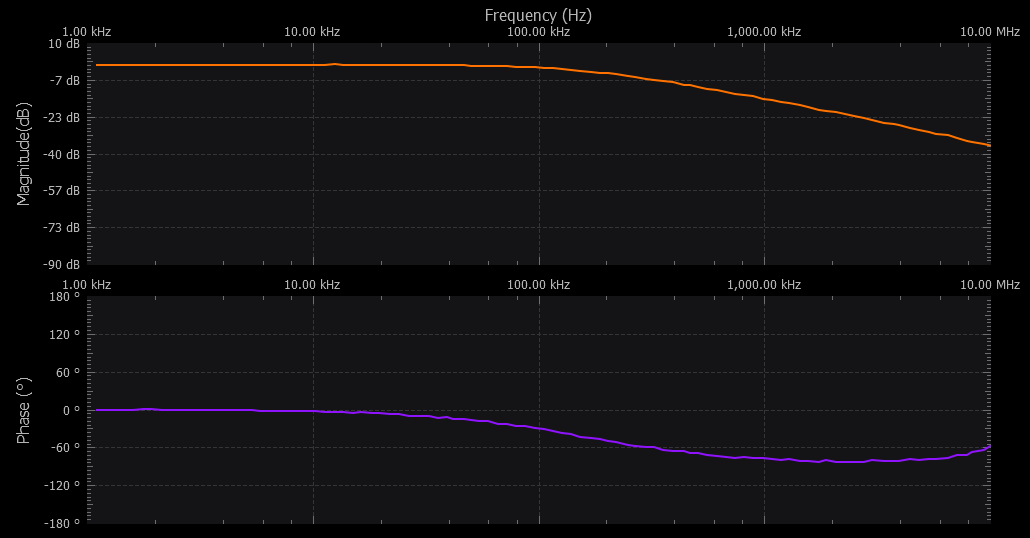
The signal’s amplitude is attenuated for frequencies larger then the cutoff frequency.
