Software User Guide
This software guide provides the essential steps for firmware installation, launching the GUI, configuring the launcher, establishing interface connections, and utilizing various tabs for effective device evaluation. This covers tasks such as daisy chain configuration, quick measurements, custom command sequences, scheduling, memory mapping, plotting, data recall, diagnostics, and EIS measurements.
Prerequisite
The AD-CELLPACKBM-SL Kit can use the available no-OS BMS embedded drivers as well as the Broadmarket BMS GUI for monitoring of crucial BMS parameters.
MyAnalog.com account is required to download the BMS software resources.
Follow the steps below to create a MyAnalog account:
Go to MyAnalog and create an account using email. Select the Register with email option to get started.
Once you have a MyAnalog account, log in to MyAnalog using your credentials.
Request for BMS Embedded Drivers
This reference design comes with no-OS BMS Embedded Drivers designed to run BMS measurements using a serial terminal.
The example projects feature the ADI Broad Market BMS boards such as the EVAL-ADBMS6830BMSW cell monitor and EVAL-ADBMS2950-BASIC pack monitor, the AD-APARD32690-SL as the microcontroller, and the DC2472A battery emulator for cell voltage input.
Tip
The BMS Embedded Drivers Installer is available upon request.
To request for access, send the following details to this email address:
BM_BMSSoftwareSupport@analog.com
Email address used for MyAnalog account creation
Company/School
Country
Purpose/Name of Project
You will receive an email confirmation that you have been granted access to the BMS Embedded Installer Package. Follow the steps below to download and properly install the file to your host PC.
Downloading the BMS Embedded Drivers Installer
Download from: BMS Embedded Drivers Version 1.0.0
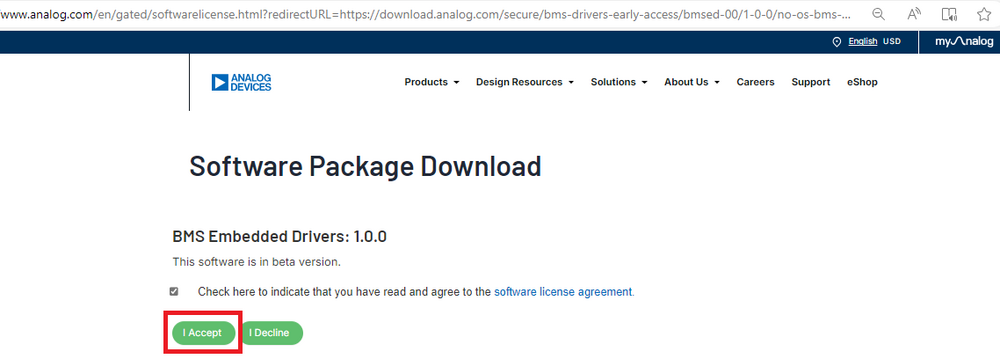
You will be directed to the Software Package Download page.
Tick the checkbox.
Then, click the I Accept button to indicate acceptance of the license agreement.
Click the Download button to download the installer package.
When software updates or new versions of the software are available an email notification will be sent to the email address associated with the MyAnalog account used to download the original software package.
Installing the BMS Embedded Drivers
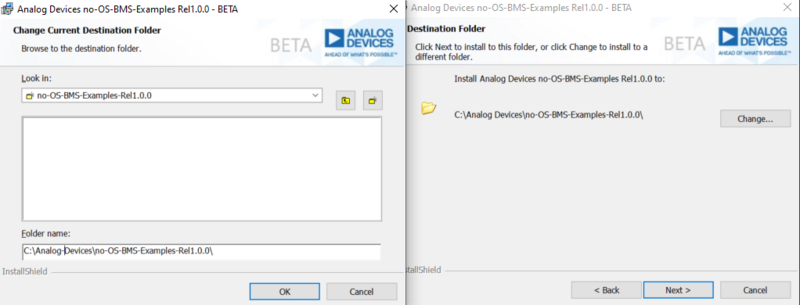
Install the no-OS-BMS-Examples-Rel1.0.0.exe file. Default installation path will be on C:Analog
Download and install MaximSDK for Maxim MCUs.
Note
Make sure that the location has NO WHITESPACES! For example, a typical installation location for the Maxim SDK could be C:MaximSDK (Windows file location notation)
While MaximSDK installation is in progress, set up the no-OS-BMS-Examples by going to the no-OS-BMS-Examples directory:
Examples Directory: C:Analogno-OS-BMS-Examples-Rel1.0.0
Select the run_setup.bat file and run it as administrator.
Note
This process will take a few minutes. Please ensure you have a stable internet connection.
During this process, the Git Bash application will pop up (running as admin).
Wait for the setup to complete.
A message “Set-up completed! with no error message” will be displayed on the command line if the setup is successful.
Press ANY KEY to close the command prompt.
Double check if the MaximSDK is successfully installed.
Click the Finish button once installation is complete.
Open the no-OS-BMS-Examples file on VS Code or any other code editor.
Examples Directory:
C:\Analog\no-OS-BMS-Examples-Rel1.0.0
Open the Makefile inside
C:\Analog\no-OS-BMS-Examples-Rel1.0.0\examplesfolder.This will display all the available example projects on the code editor.
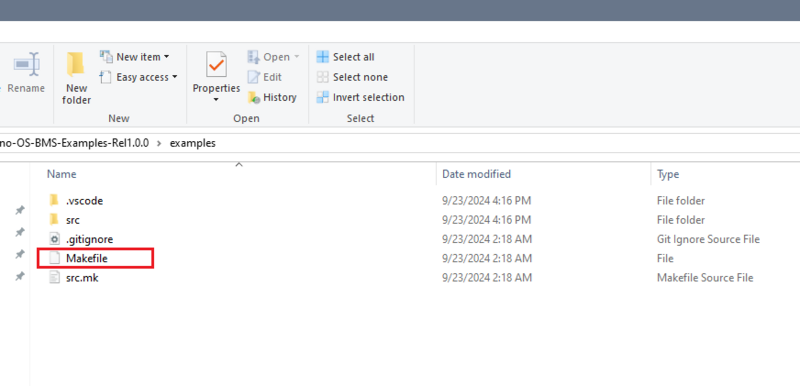
Configure the Makefile on your desired example project.
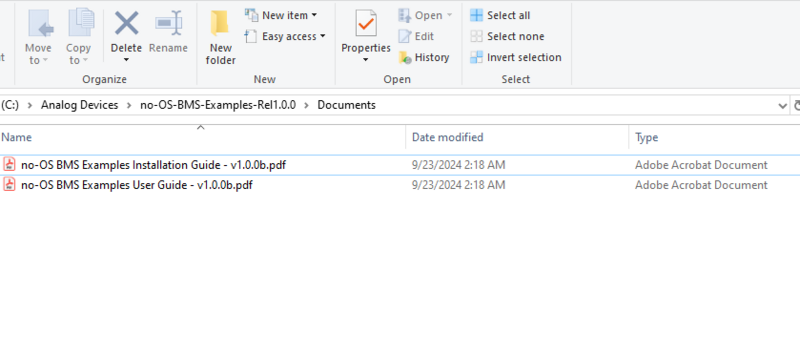
The complete procedure on how to use the no-OS BMS examples can be found in the guide inside the Documents folder:
File Location: C:\Analog\no-OS-BMS-Examples-Rel1.0.0\Documents
Graphical User Interface
Downloading the GUI Installer
Download
Evaluation GUI for ADI Broad Market BMS products:
When software updates or new versions of the software are available an email notification will be sent to the email address associated with the MyAnalog account used to download the original software package.
Launching the GUI
To launch the GUI, navigate to the BMS_BROWSER_GUI_BroadMarket_V2.0.0 directory.
Double-click the BMS_BROWSER_GUI_BroadMarket_V2.0.0.exe file.
Launcher Configuration
Use the launcher page to configure a daisy chain of ADBMS devices.
Select an appropriately flashed microcontroller board (for this example, SDP-K1).
Launch the evaluation GUI.

Establishing Interface Connection
The Interface Connection` section displays available SDP-K1 devices on the left.
Left-side selection determines the device for launching the evaluation GUI with the Launch Button.
If the GUI is open, the connected COM port appears on the right.
Click Disconnect` to terminate the connection for a new one.
Use the refresh button to reload the available MCU boards list.

Daisy Chain Connection
The Daisy Chain section facilitates the creation of a daisy chain using compatible ADBMS devices. This process involves selecting a generation of ADBMS devices, adding devices to the daisy chain, and configuring the setup for the evaluation GUI.

Select ADBMS Generation
Navigate to the Daisy Chain section.
Use the first option to choose a specific generation of ADBMS devices.
Note
Devices within a selected generation are compatible and can be used together in the evaluation GUI.
Add Devices to the Daisy Chain:
After selecting the generation, locate the available devices list.
Choose a device for the daisy chain.
Press the right chevron button to append the selected device to the daisy chain.
This added device becomes the next farthest in the daisy chain.
Remove Devices from the Daisy Chain:
To remove a device, go to the daisy chain table.
Select the device you want to remove.
Press the trash can button to delete the selected device from the daisy chain.
Configure Daisy Chain for GUI Launch:
In the Interface Connection section, select the desired MCU board.
Configure the daisy chain in the Daisy Chain section.
Click on the launch button to initiate the evaluation GUI.
GUI Tabs
Quick Measure
The Quick Measure tab simplifies metric measurement with a preloaded command sequence. Note that it supports a single device in the daisy chain, and key features enhance configuration and visualization.
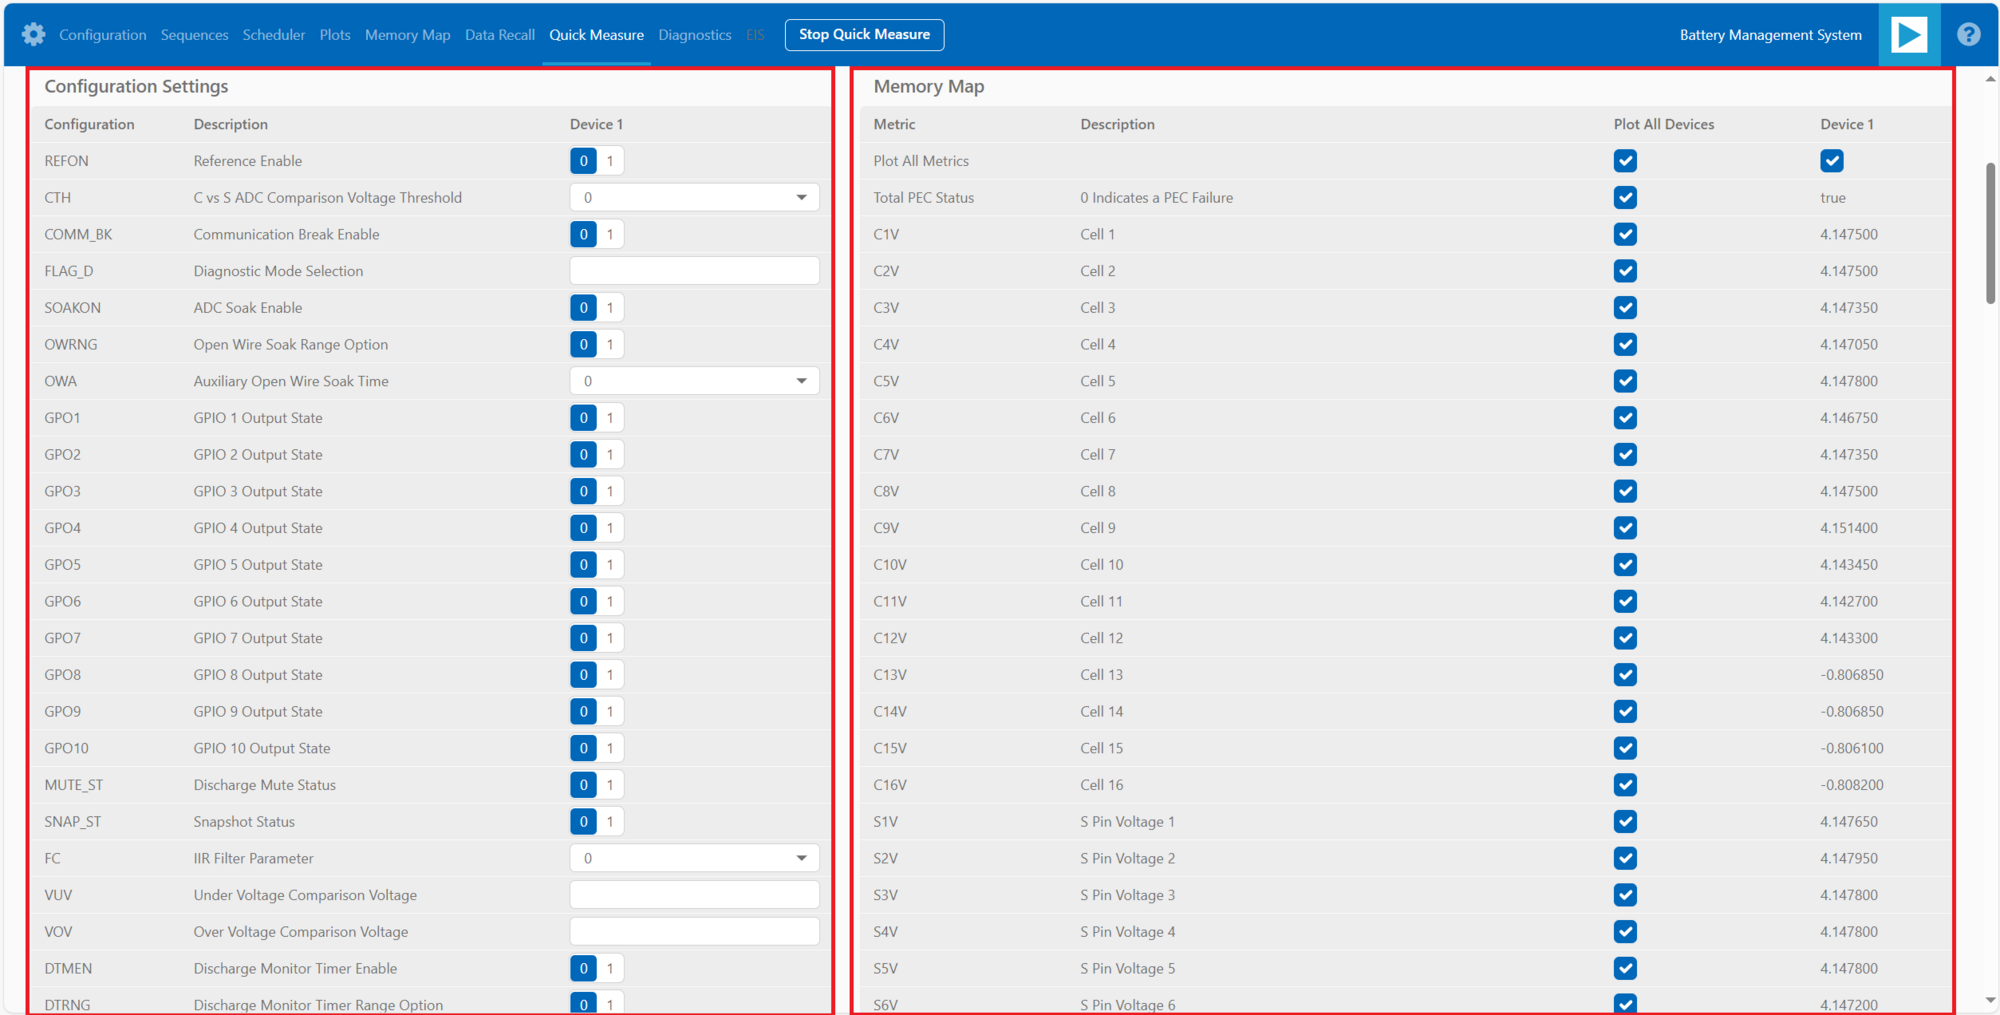
Preloaded Commands:
Access the Quick Measure tab for easy metric measurement with a preloaded command sequence.
Daisy Chain Limitation:
Note: Quick Measure tab supports only a single device in the daisy chain, configured for the last device.
Quick Configuration:
Utilize the lower-left section for swift changes to commonly modified bitfields.
Numeric Data Display:
In the lower-right section, view numeric data returned from devices.
Control plotted data on the central plot using checkboxes.
Central Plot Visualization:
The central plot provides a graphical representation of captured data.
X-axis: Sample number;
Y-axis: Metric-specific variation.
Measurement Loop Control:
Initiate and terminate the measurement loop with the top button.
The button turns yellow during loop activation and green when deactivated.
Sequences
The Sequences tab enables the creation and management of custom command sequences. Load and save sequences, divided into Init and Loop lists. The Init list initializes the daisy chain once, while the Loop list runs continuously until stopped. Toggle between lists using the corresponding buttons at the top.
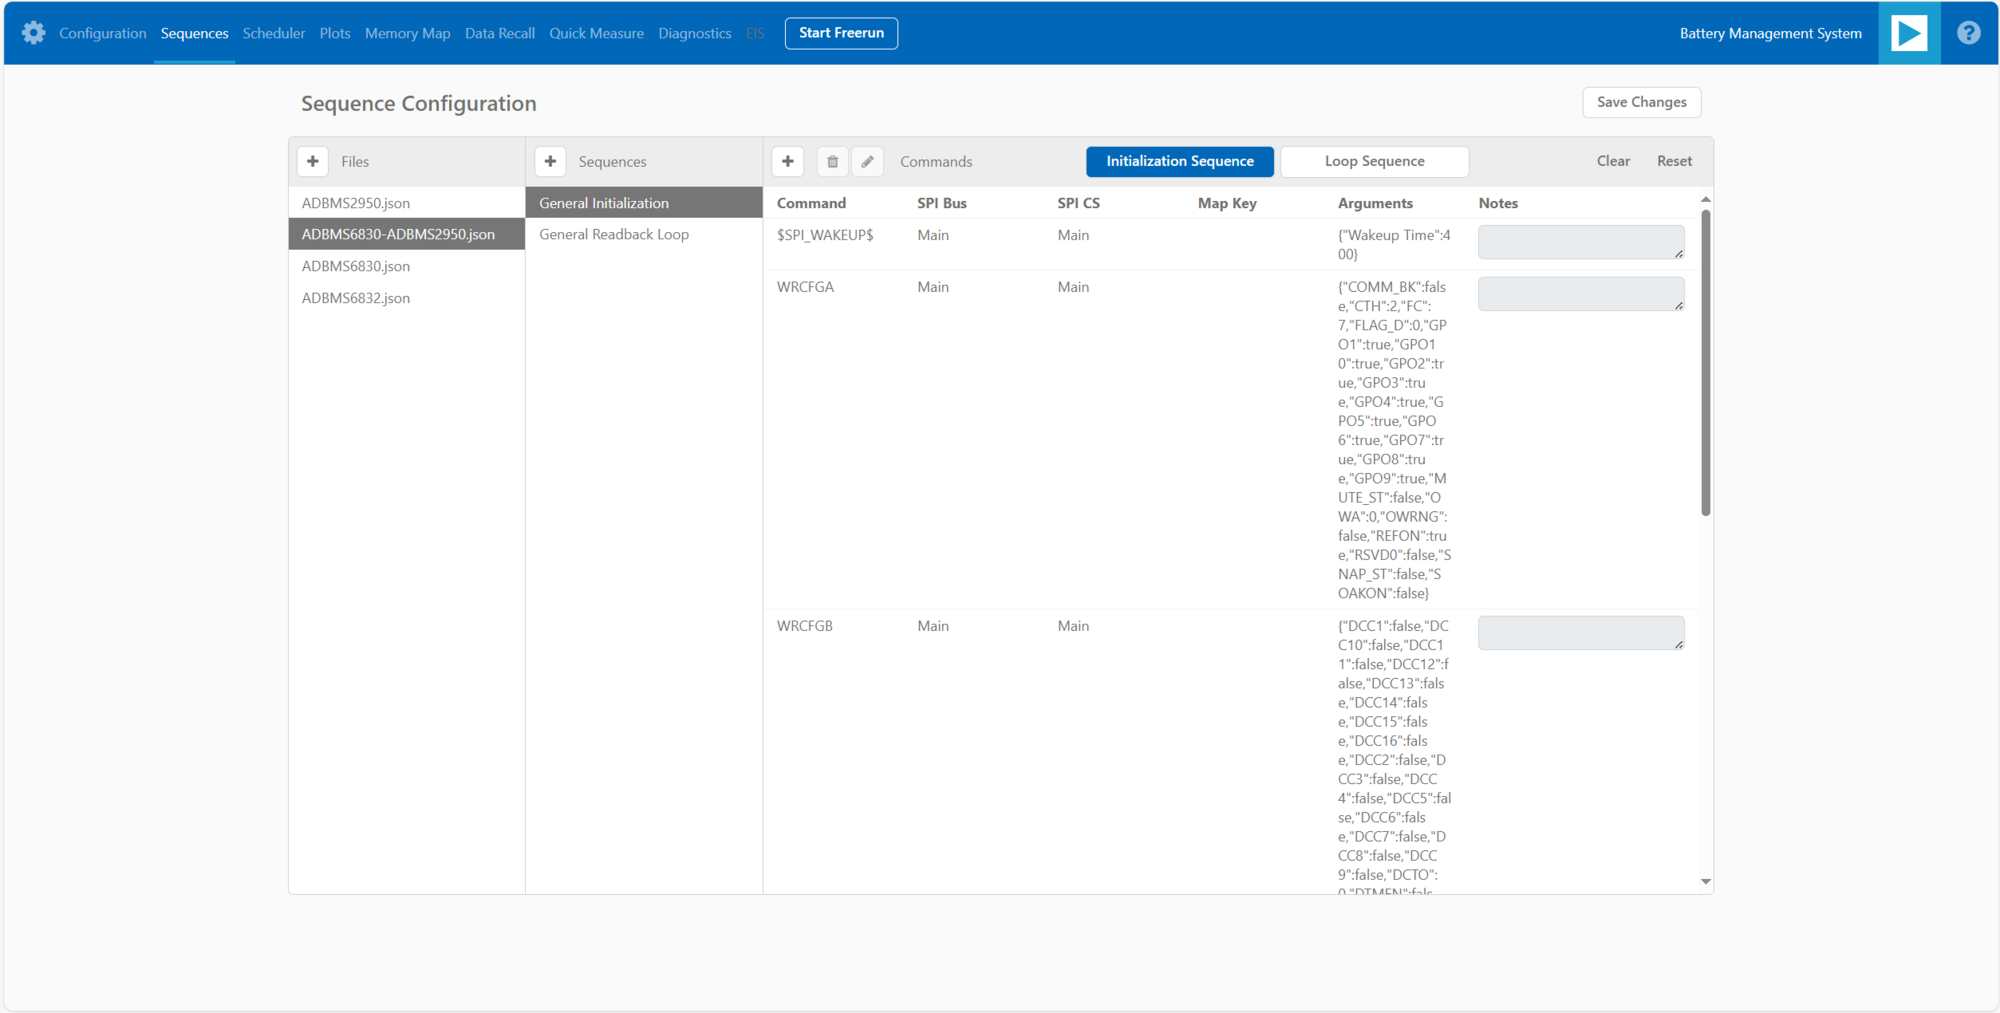
Load Existing Sequence:
Use the Existing Sequence Files select bar to choose an existing sequence file.
Select the desired sequence from the Existing Sequences select bar.
Save Sequence:
In the New Sequence File text area, enter the name for the new sequence file.
Specify the sequence name in the New Sequence Name text area.
Press the save button to save the sequence.
Load Defaults:
Load the default command list for the Quick Measure tab by pressing the Load Defaults button.
All sequence files are saved in the installation location under the data/sequence directory.
Add Command:
On the left side of the screen, use the select boxes and buttons to add a command to the selected command list.
Select a command from the Commands select box to load available bitfields on the bottom left.
Modify bitfields as needed and press Add to add the command to the list on the right side.
Manage Commands:
On the right side, select a command to highlight it for modification.
Replace, move (drag-and-drop), or delete the highlighted command using the corresponding buttons.
SPI Bus and Chip Select:
Under the Command select bar, use the SPI Bus and SPI CS Select bars to change the SDP-K1 SPI bus and chip select for the command.
Optional Map Key:
Below the SPI Bus and SPI CS Select bars, use the optional Map Key field to apply a label to the command.
Labels organize output data, grouping commands with the same label together for focused data analysis.
Scheduler
The Scheduler tab provides insights into the execution time of sequences from the Sequences tab. It allows combining sequences for a complete execution loop. Key features enable precise timing adjustments and visualization.
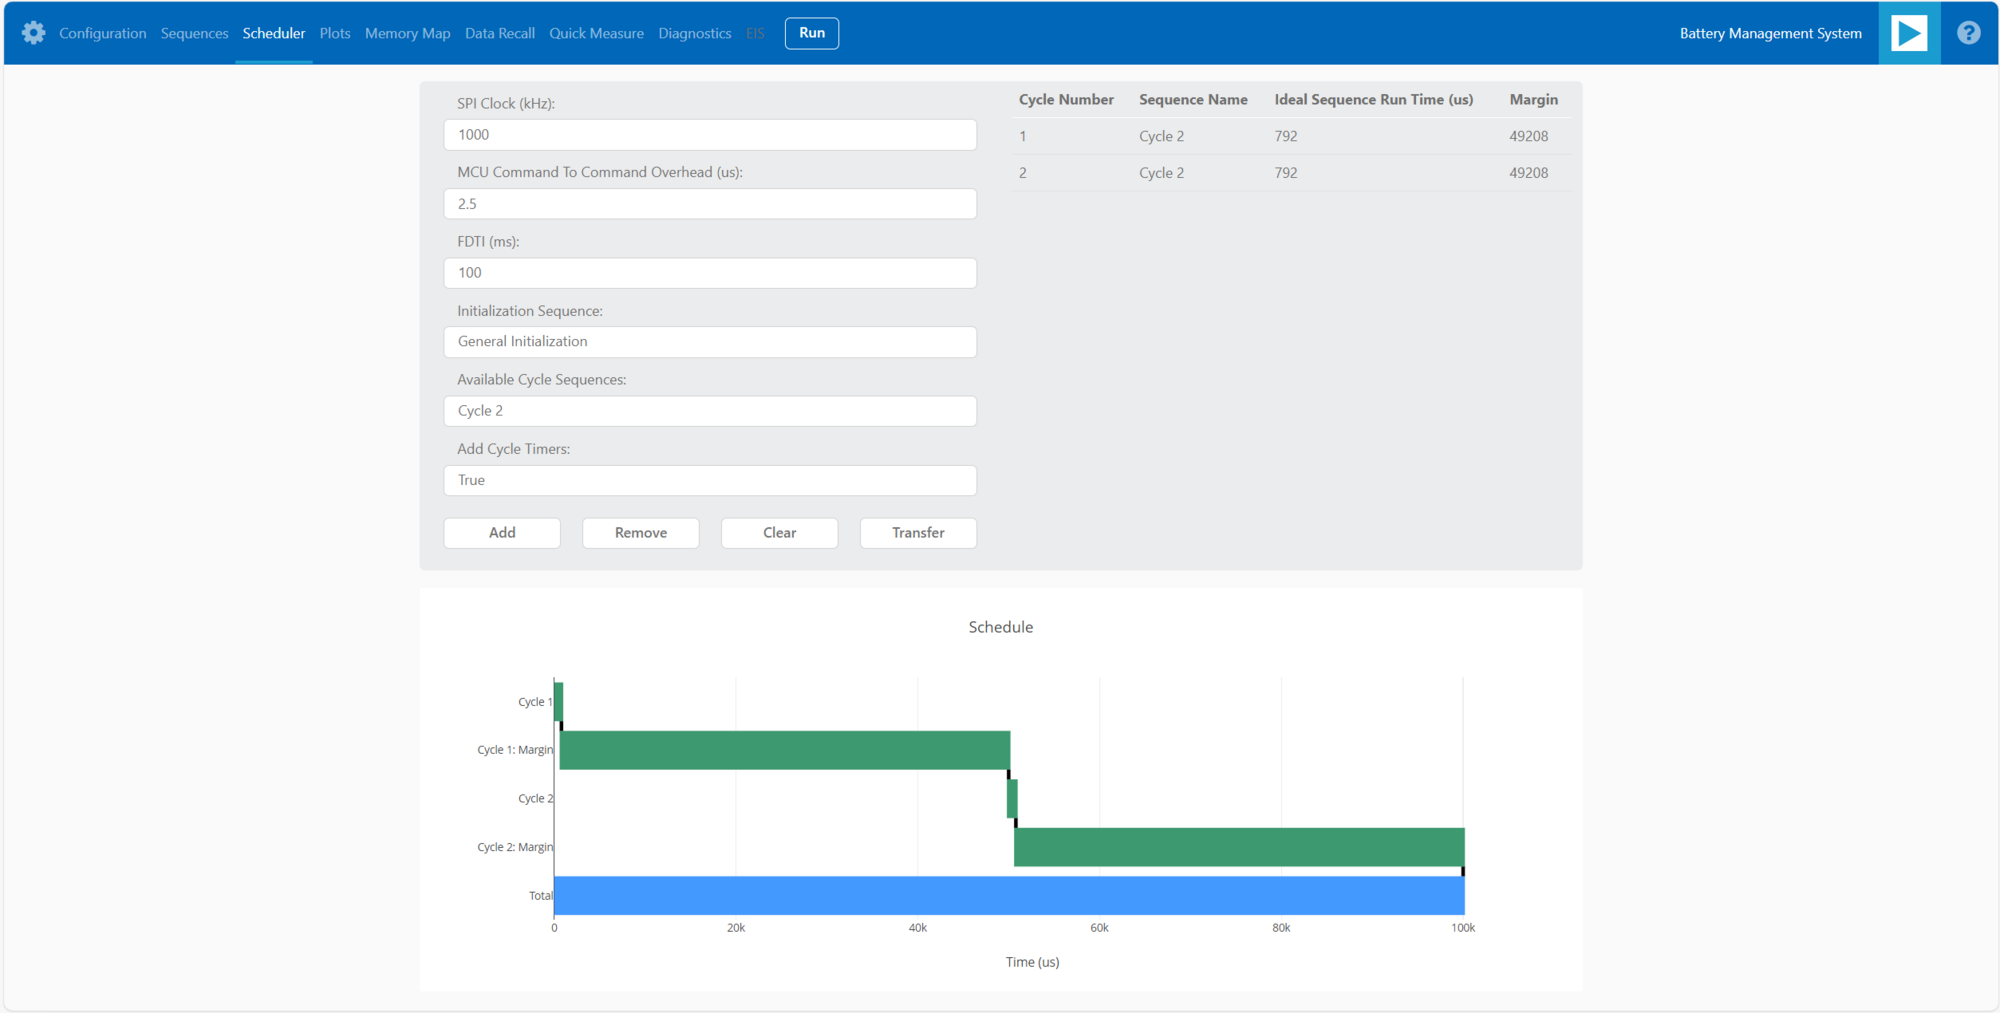
Timing Adjustments:
Utilize the SPI Clock field to adjust timings based on the system SPI clock frequency (kHz).
The MCU Command to Command Overhead field adjusts timing between commands to accommodate MCU transaction timings.
The FDTI field represents the total loop time, used for margin calculations.
Initialization and Sequence Management:
Choose the Initialization field to pick the sequence for daisy chain initialization.
The Available Cycle Sequences list displays all available sequences for scheduling.
Use the Add button to add selected cycles to the schedule.
Hardware Timers and Timing Verification:
Add hardware timers to cycle sequences with the Add Cycle Timers field for timing verification in freerun mode.
Schedule Management:
Remove and Clear buttons allow removal of cycles from the schedule.
Drag and drop cycles to rearrange them within the schedule.
Schedule Overview:
The schedule table displays added cycles, their execution time, and margin for the selected daisychain.
The plot at the bottom visually represents the same information in a waterfall format.
Transfer for Real Hardware Timing:
Use the Transfer button to move all cycles into a single sequence in the Sequences tab.
Run the transferred sequence to assess real hardware timing.
Memory Map
The Memory Map tab provides a numerical output for the active command loop, organized into tables for user convenience. It offers customization and error highlighting for effective data analysis.
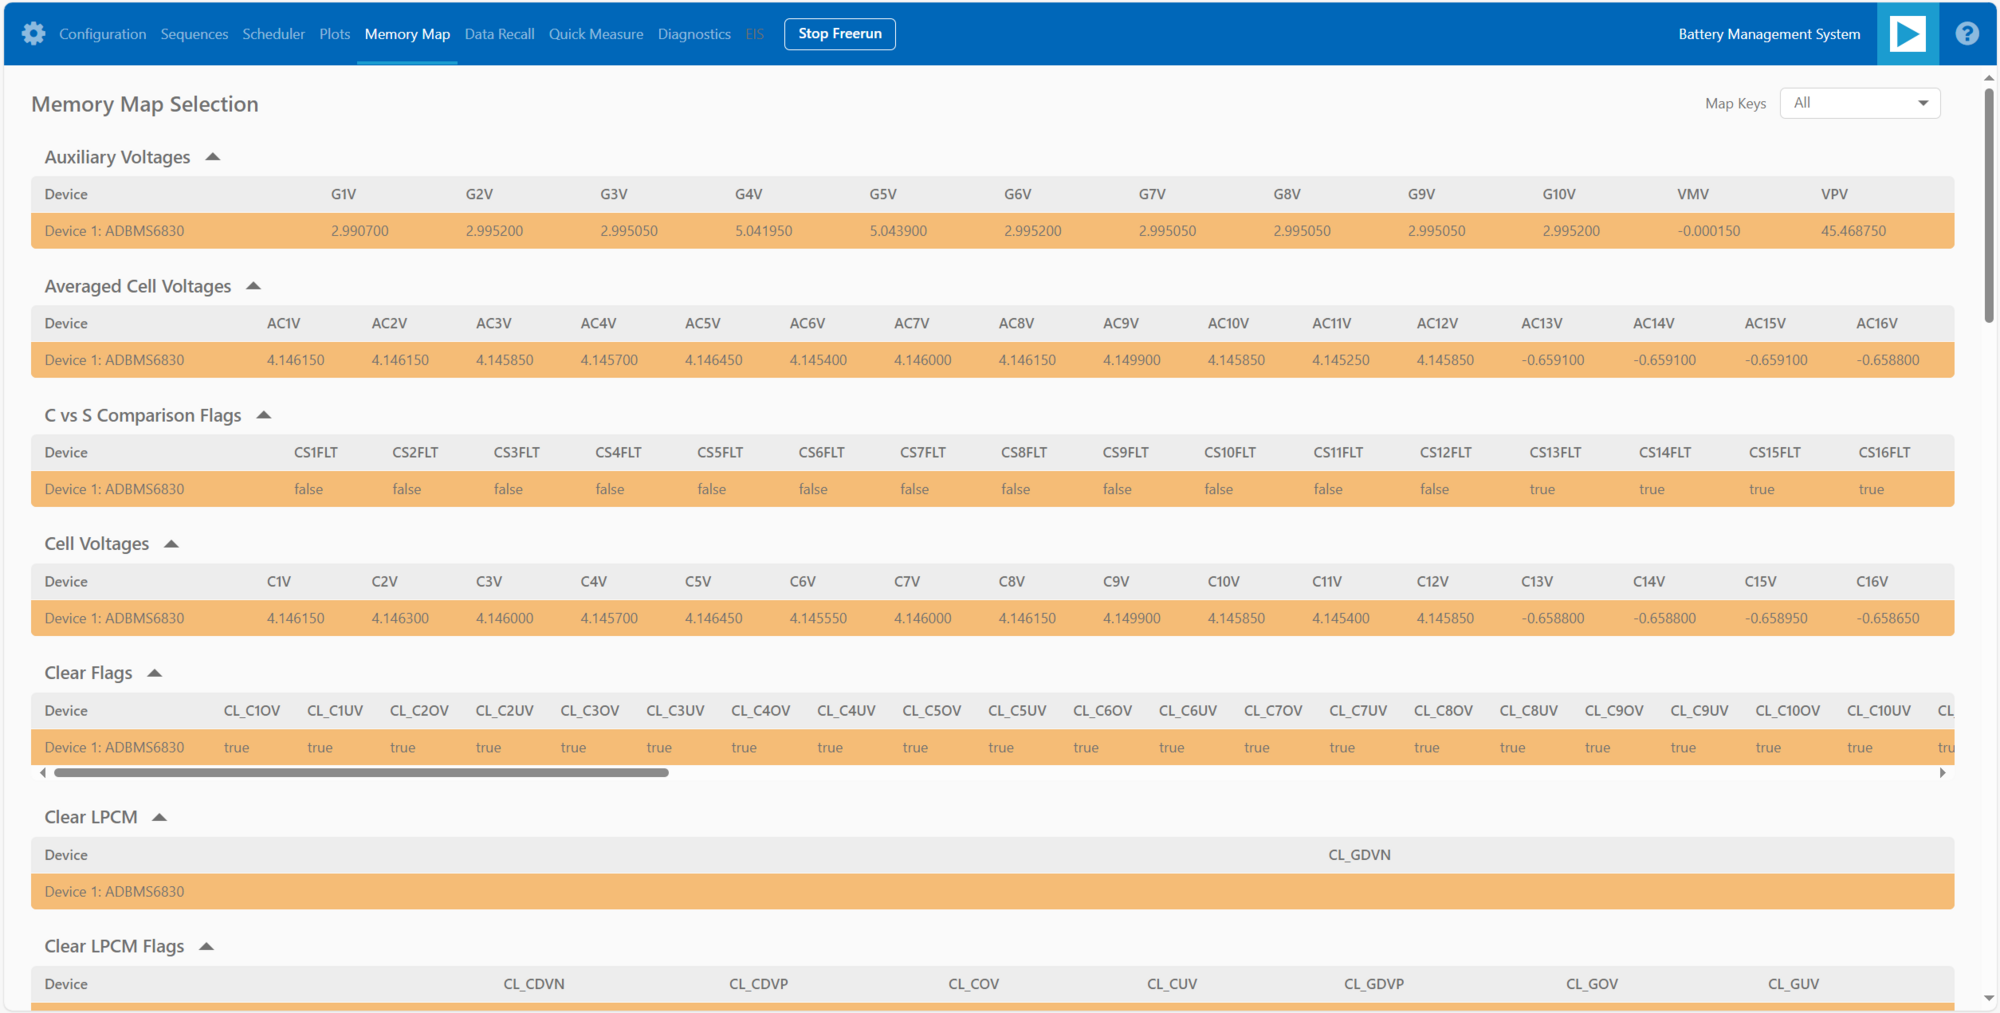
Organized Data Display:
Access the Memory Map tab for a numerical output of the currently running command loop.
Multiple tables organize the data into useful groups.
Table Management:
Each table can be minimized for a more streamlined view.
Default View and Map Key Selection:
The default view presents all data from the command list.
Use the Map Key select bar to switch to a specific group of data for focused analysis.
Device-specific Data:
Tables contain data returned by all devices in the daisy chain.
Error Highlighting:
Rows highlight in orange if data returned with a PEC error.
Valid data does not have any highlighting for easy differentiation.
Plots
The Plots tab provides a graphical representation of data collected through the running command loop. It offers customization options for focused analysis and allows for the export of captured data for further analysis.
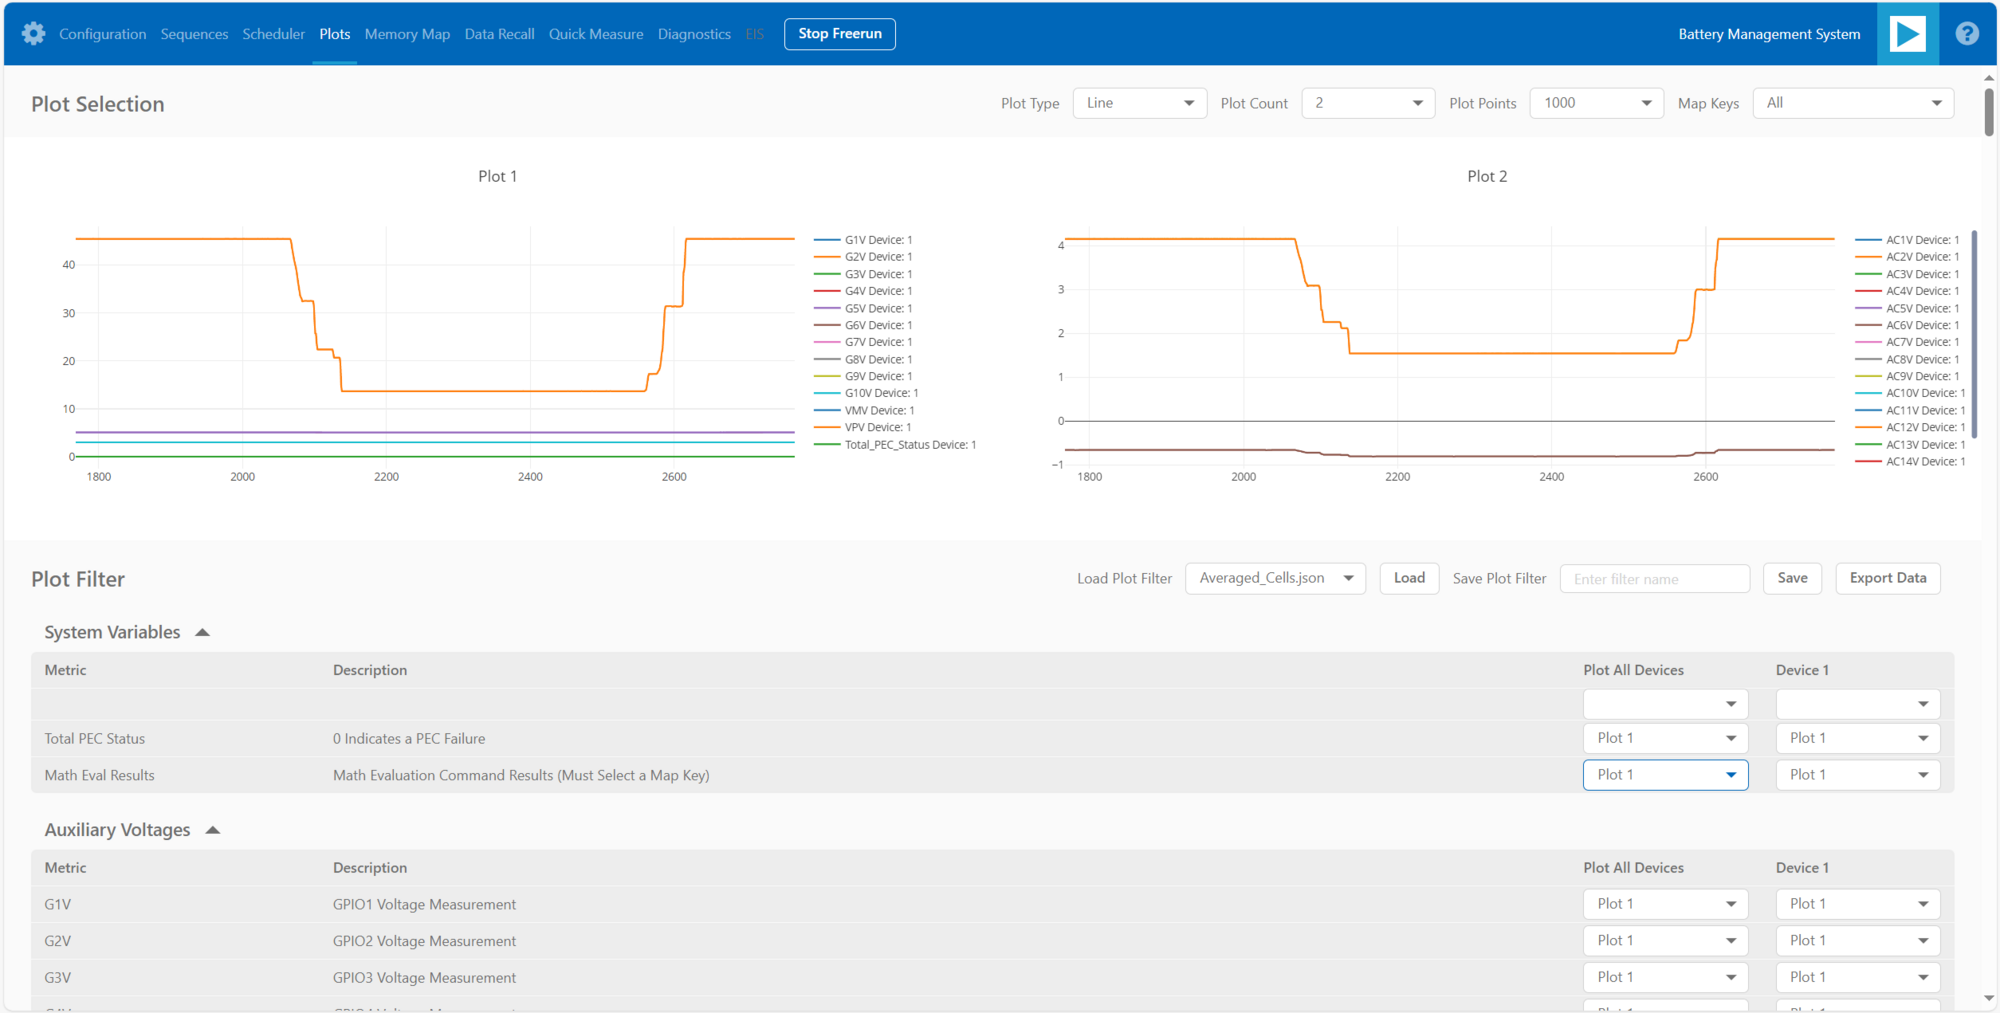
Plot Selection:
Use the Plot Selection area at the top to control the central Plot.
Checkboxes in the Plot Filter area at the bottom filter data for the Plot.
Metric Plotting:
Check the Plot Filter checkboxes for desired metrics and device numbers.
Additional checkboxes allow for plotting all devices for a metric, all metrics for a device, or all metrics for all devices.
Save and Load Filter Setups:
Save a filter setup for future use by providing a name in the Save Plot Filter text box and clicking Save.
Load existing filter setups using the Load Plot Filter select.
Map Key Group Selection:
Narrow data to a specific map key group using the Map Key select in the Plot Selection area.
Plot Options:
Choose between line chart and histogram using the Plot Selection Type select.
Export Data:
Click the Export Data button to export captured data as a CSV file for further analysis.
Data is exported to the data directory, grouped by map key.
Data Recall
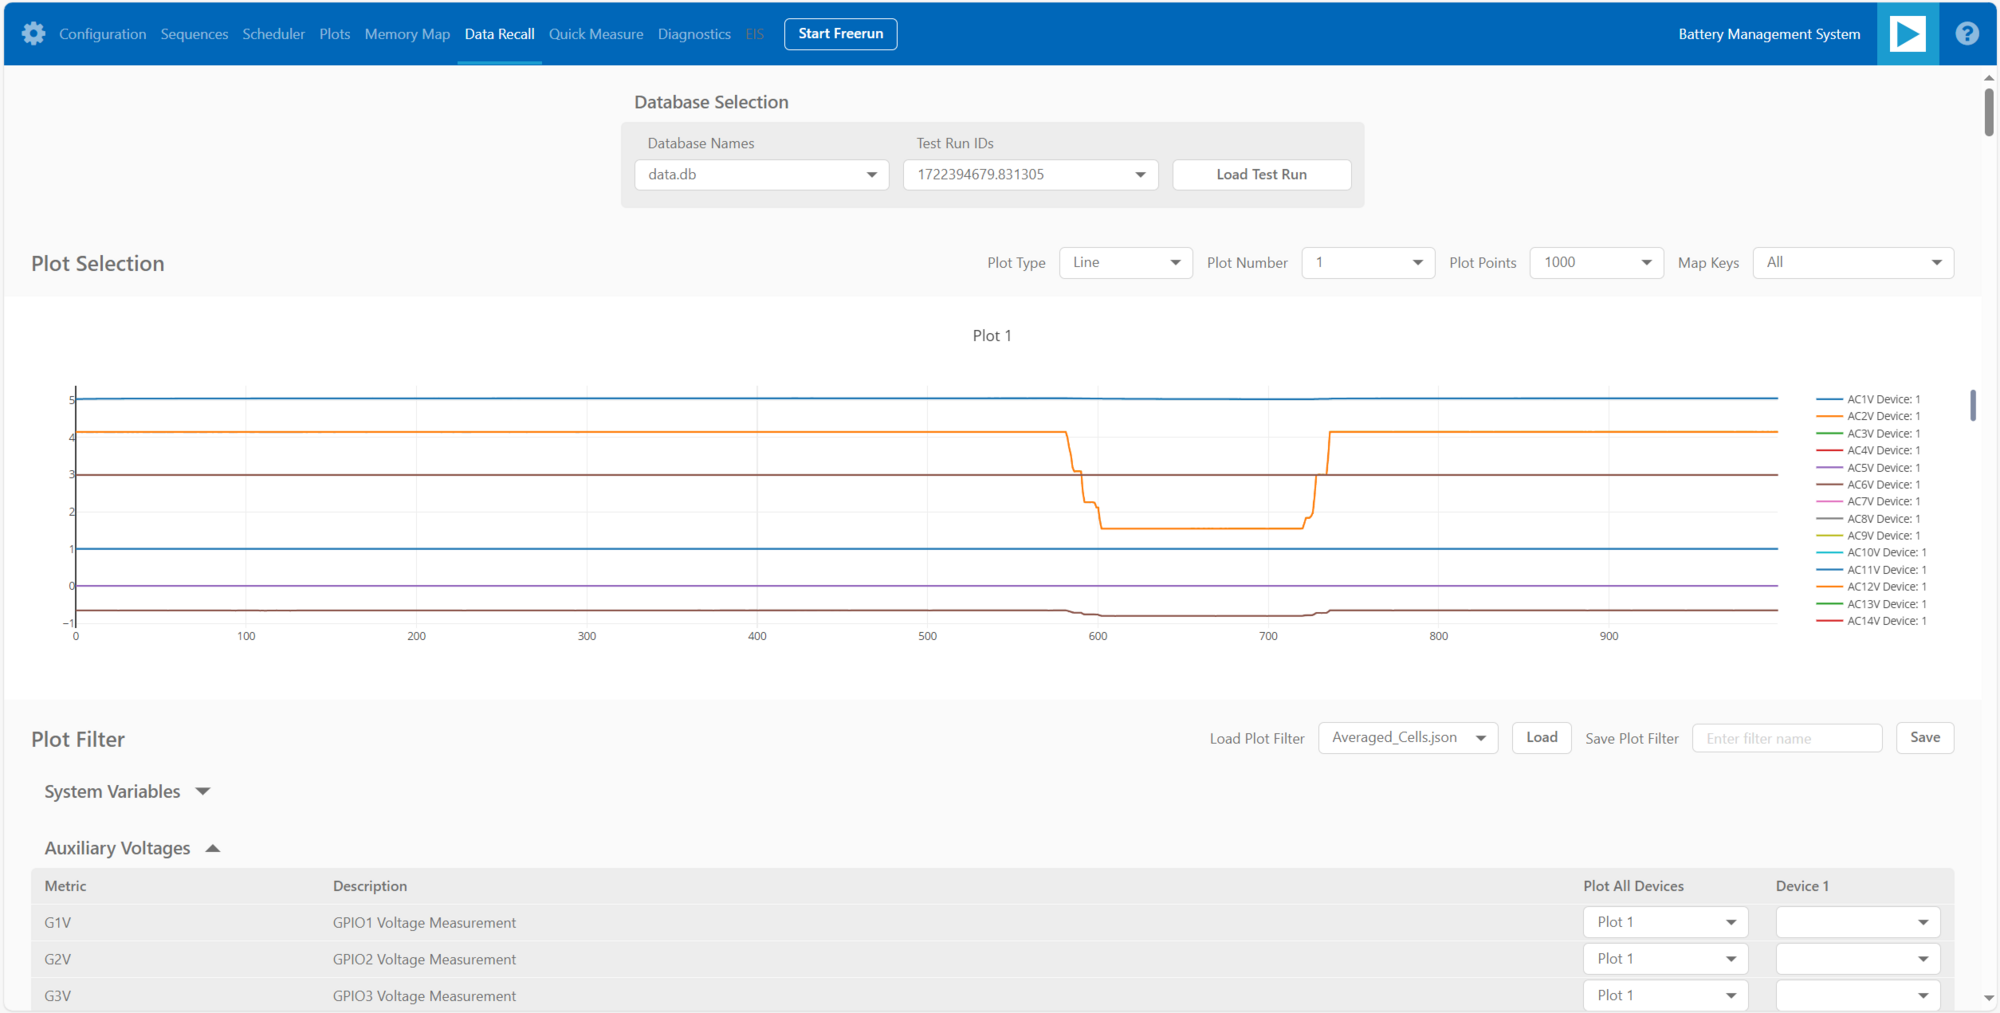
The Data Recall tab allows you to retrieve and plot data from previous freerun sessions stored in a database file. The interface is similar to the Plots tab with added functionality for selecting the database file and test run.
Access Data Recall Tab:
Navigate to the Data Recall tab for recalling and plotting data from previous freerun sessions.
Database File Selection:
Click on the select box under the Database Names label.
Choose the desired database file; the default is data.db.
Test Run Selection:
Click on the select box under the Test Run IDs label.
Pick the specific test run from the list, arranged chronologically and UTC timestamped.
Load Test Run:
Click the Load Test Run button to recall data from the selected database file and test run.
Customize Plot:
After loading the test run, customize the plot using the same methods as the Plots tab.
Diagnostics
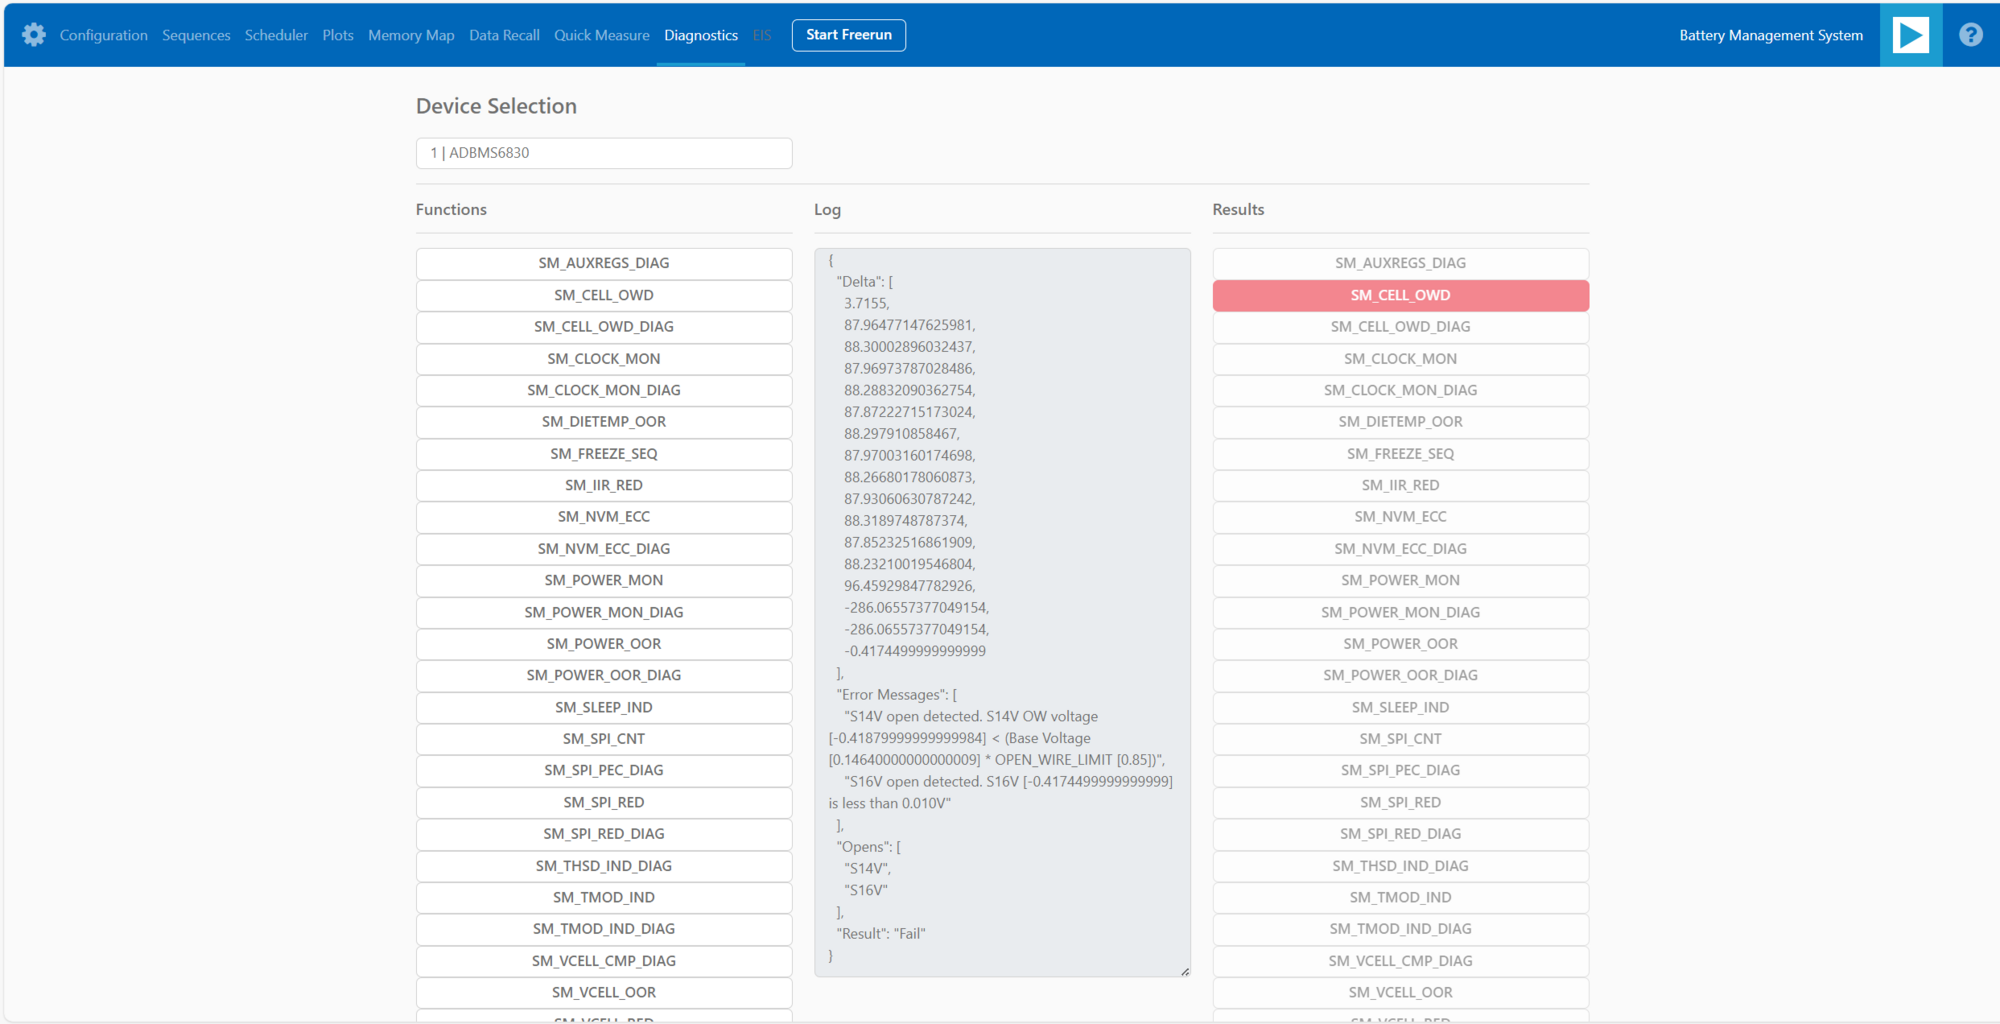
The Diagnostics tab offers a straightforward way to execute on-device diagnostics following the device’s safety manual. It displays available diagnostics, test logs, and results for a single device.
Access Diagnostics Tab:
Navigate to the Diagnostics tab for on-device diagnostics execution.
Device Selection:
Use the Device Selection bar to switch between devices.
Run Diagnostics:
In the Functions section on the left, click on the button with the name of the desired diagnostic.
The diagnostic runs, and results are displayed on the right side: highlighted green for pass and red for failure.
Diagnostic Log:
A log of diagnostic-specific data appears in the center of the screen.
The log provides context for understanding why a diagnostic may have failed.
