Software User Guide
Equipment needed
AC power supply or connection to mains for the measurement side
Mains or USB type C connector cable for supplying power to the board
PC running Windows or Linux
Cable to build the assembly
USB type C connector cable to connect to the USB port of the PC. (this can be used also to deliver power to the board)
AD-PQMON-SL evaluation board
Optional:
MAX32625PICO for debug and programming
Testing
The following software is needed for testing the AD-PQMON-SL board:
Firmware (link available in the resources section)
Scopy with the AD-PQMON-SL add-on
For Scopy installation, follow the steps indicated in the user guide.
After making the board connections and installing Scopy, connect to the GUI by following these steps:
Connect the USB Type-C cable from the AD-PQMON-SL board to your PC.
Launch the installed Scopy application.
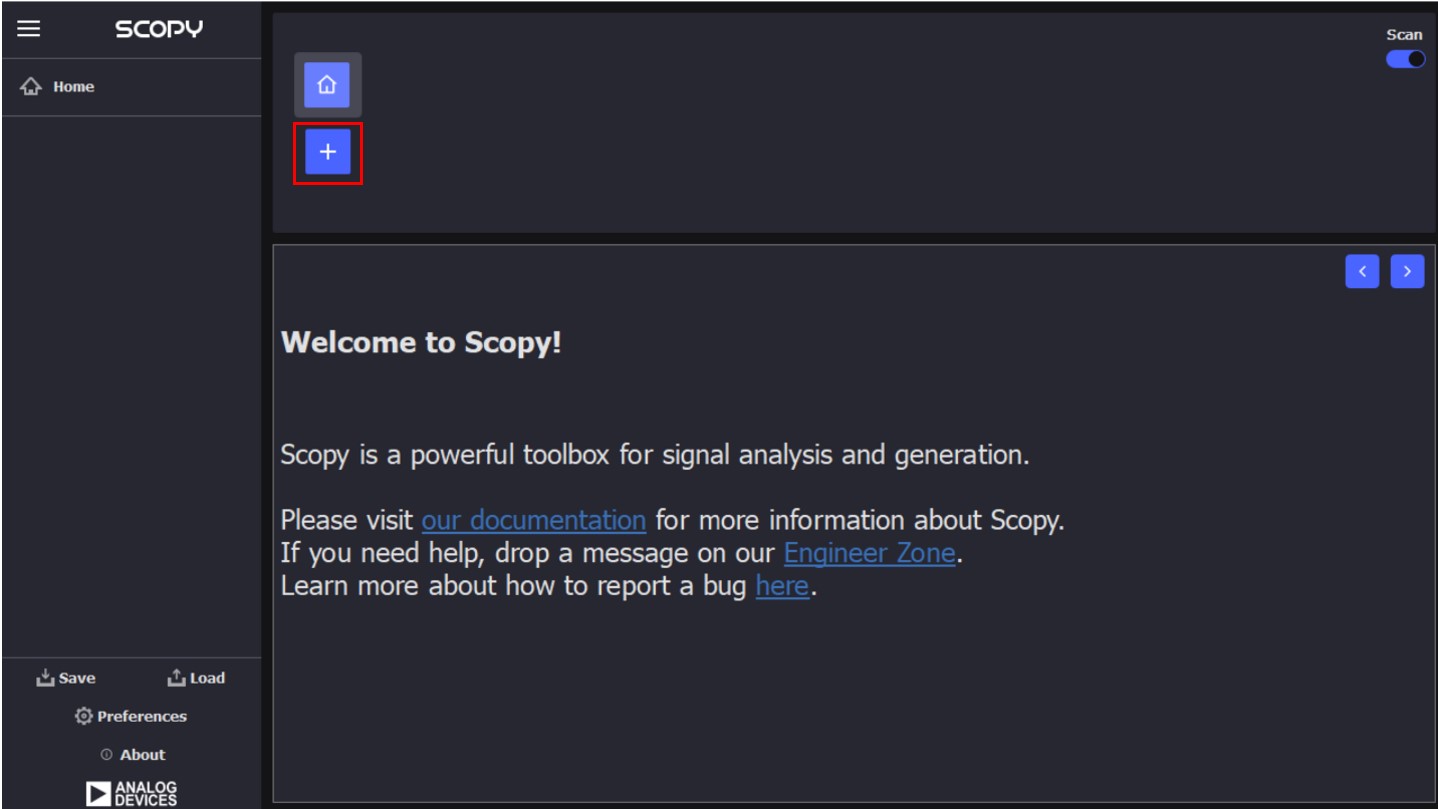
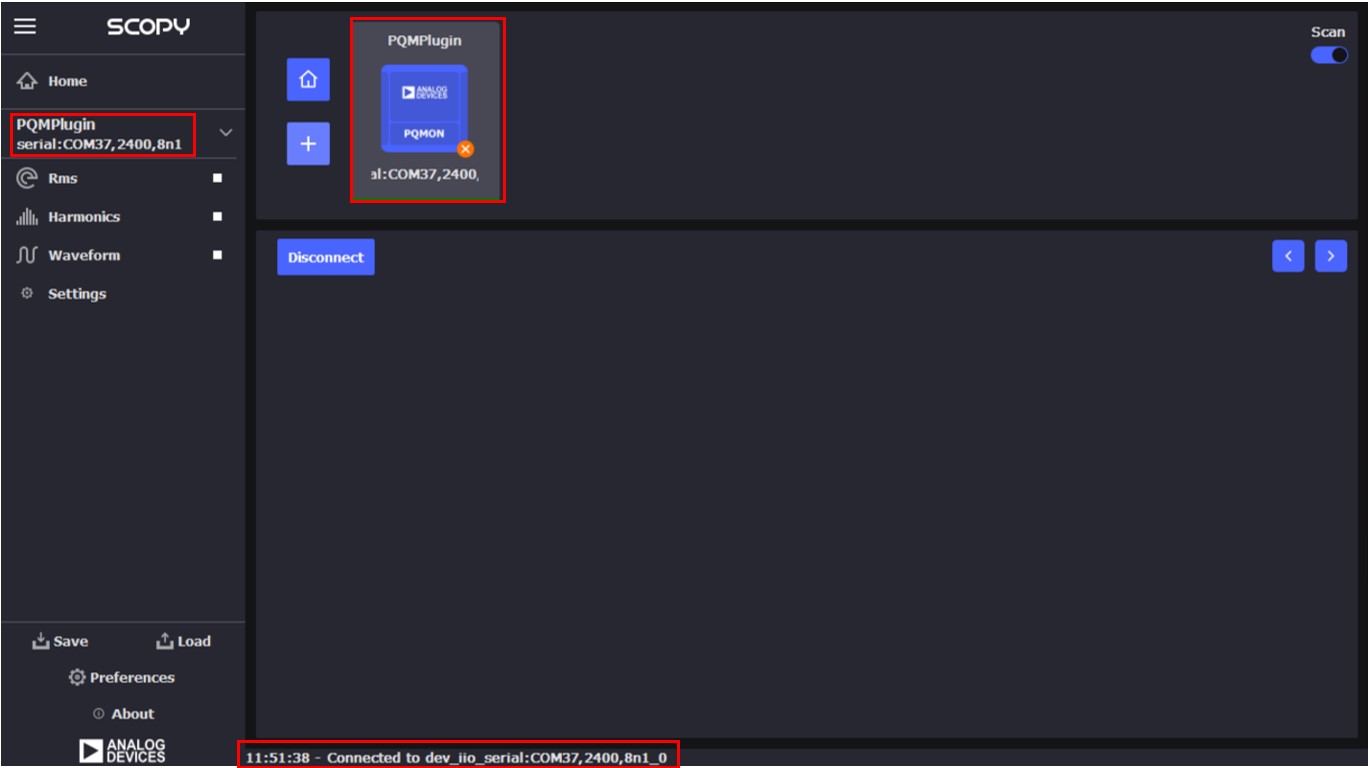
Click the “+” button as shown in the following image:
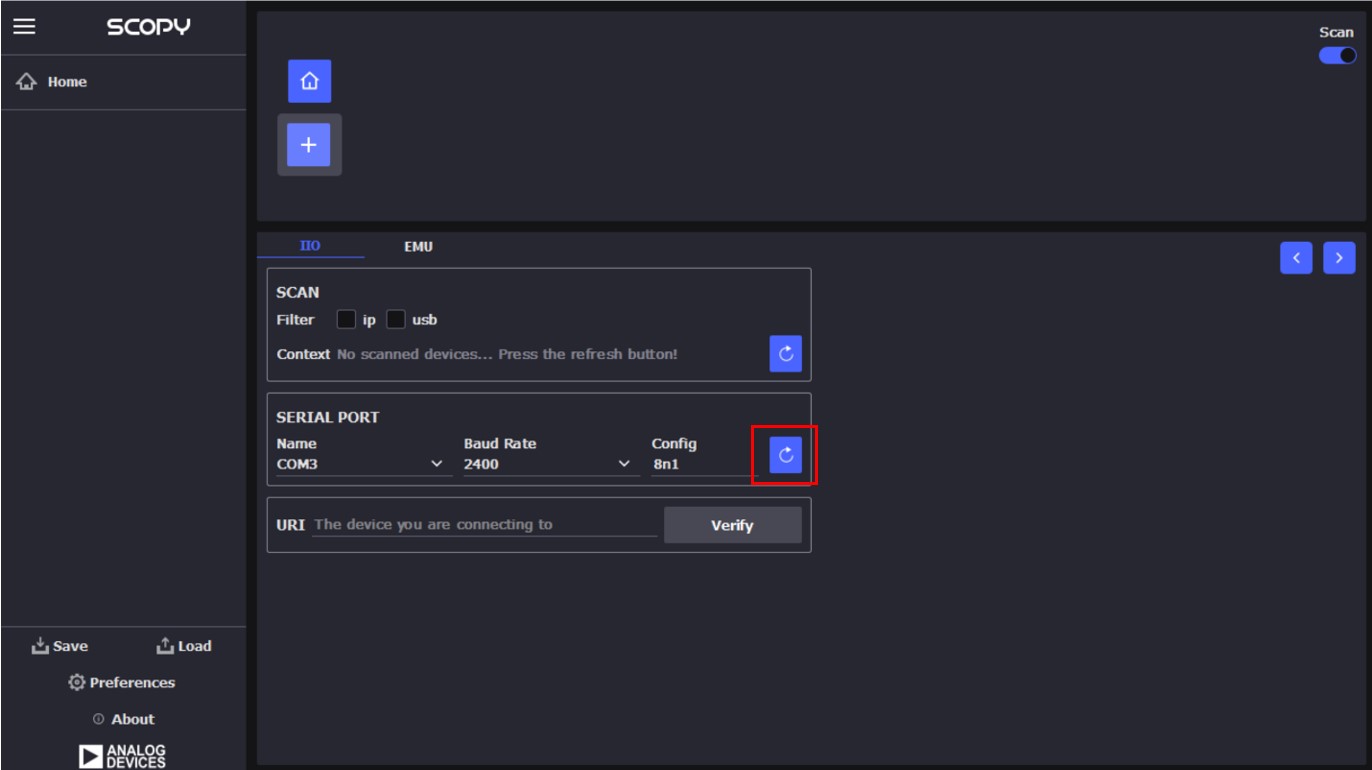
In the window that opens, click the refresh button as shown in the following image:
From the drop-down menu labeled
PORT NAME, select the COM port connected to the AD-PQMON-SL board (for example, COM37).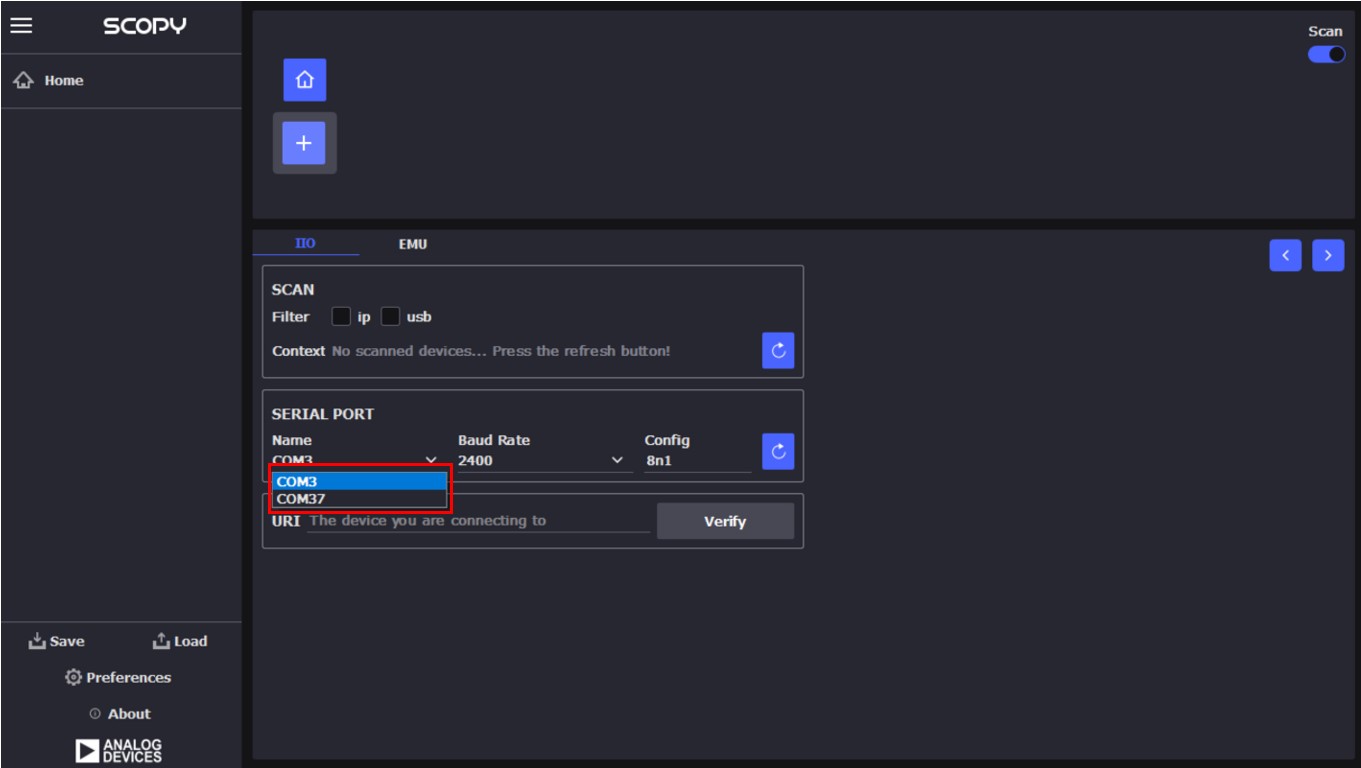
After selecting the correct COM port, the URI field will be automatically populated.
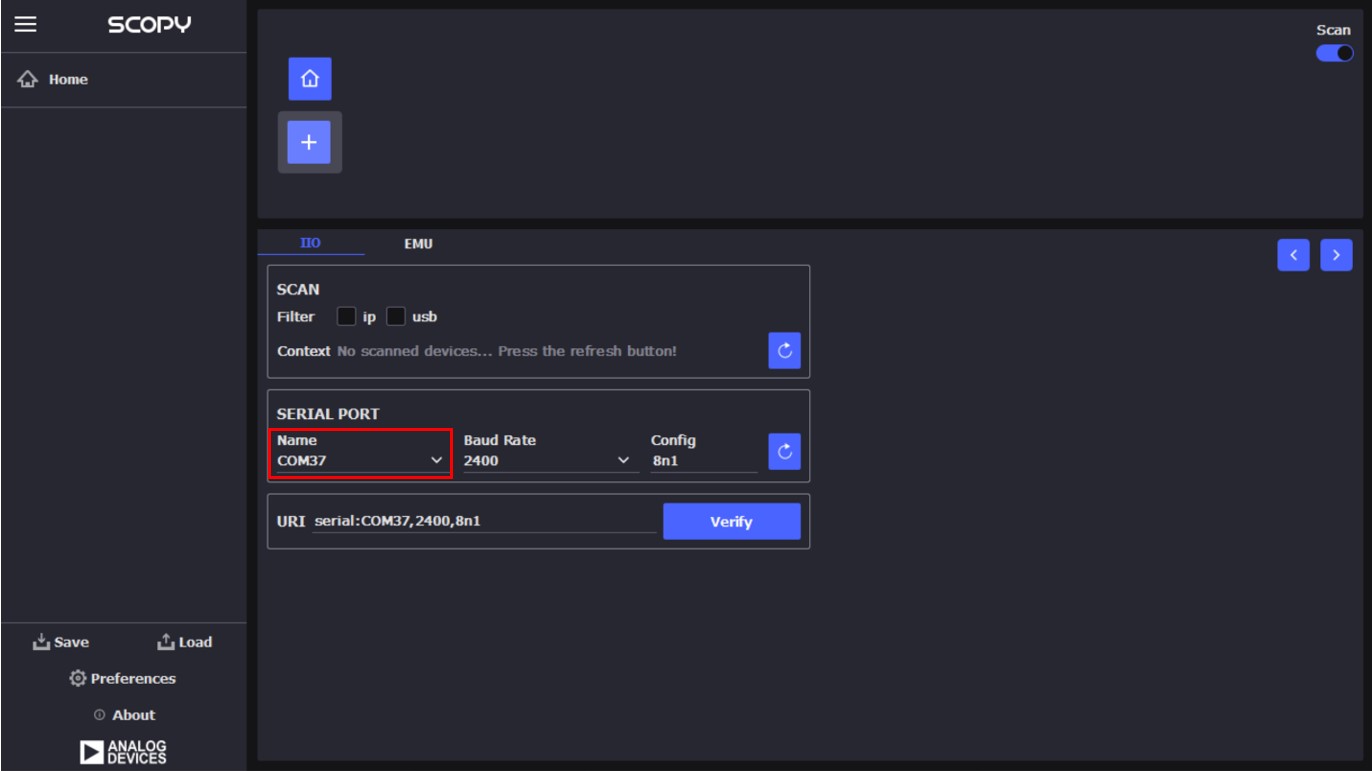
Click the
Verifybutton.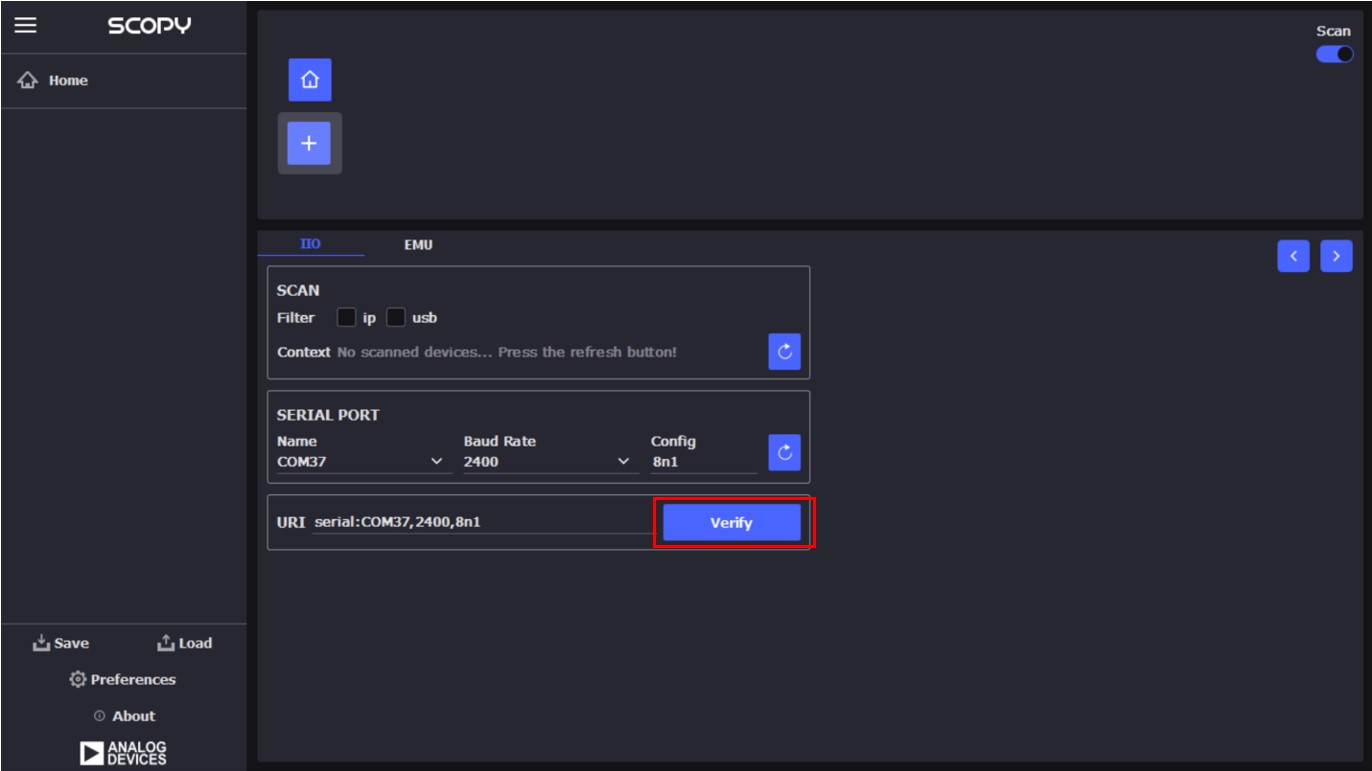
Ensure that
PQMPluginis selected in the plugin list.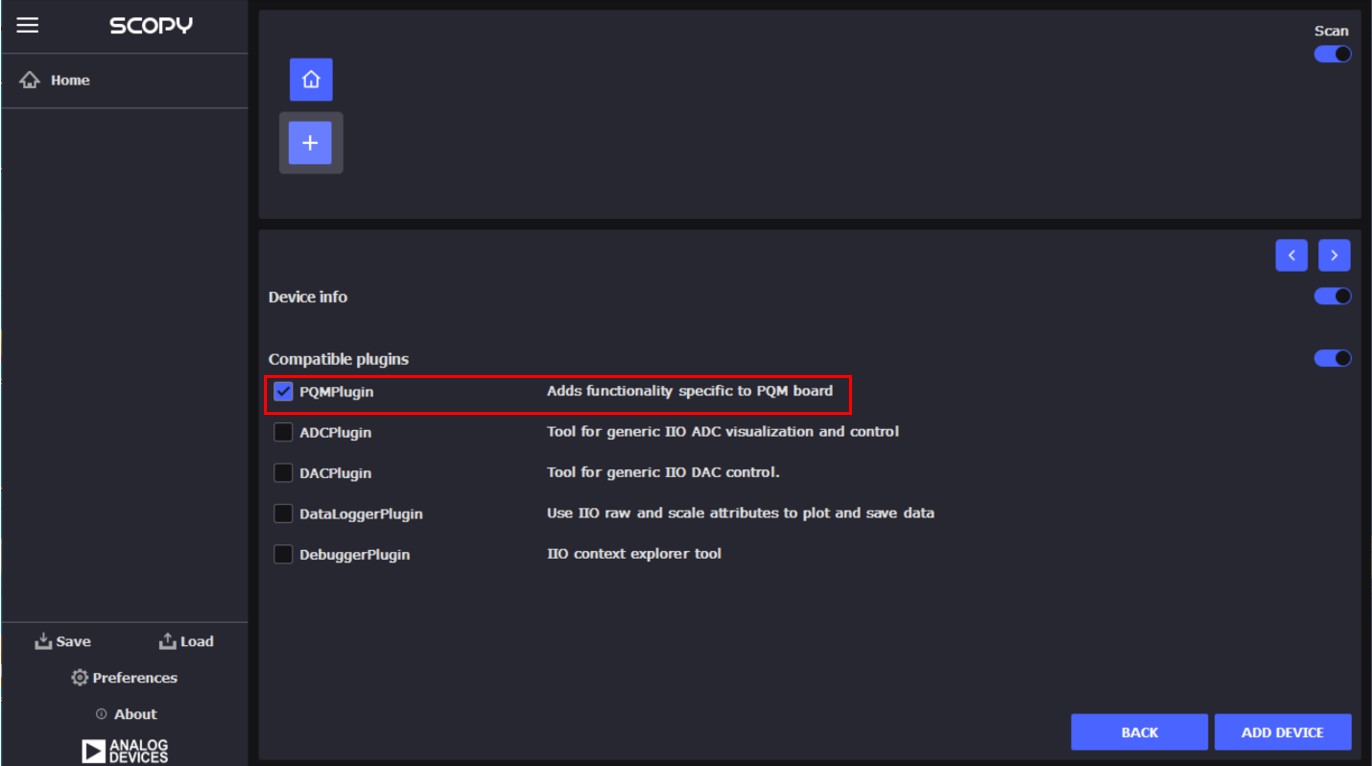
Click the
ADD DEVICEbutton.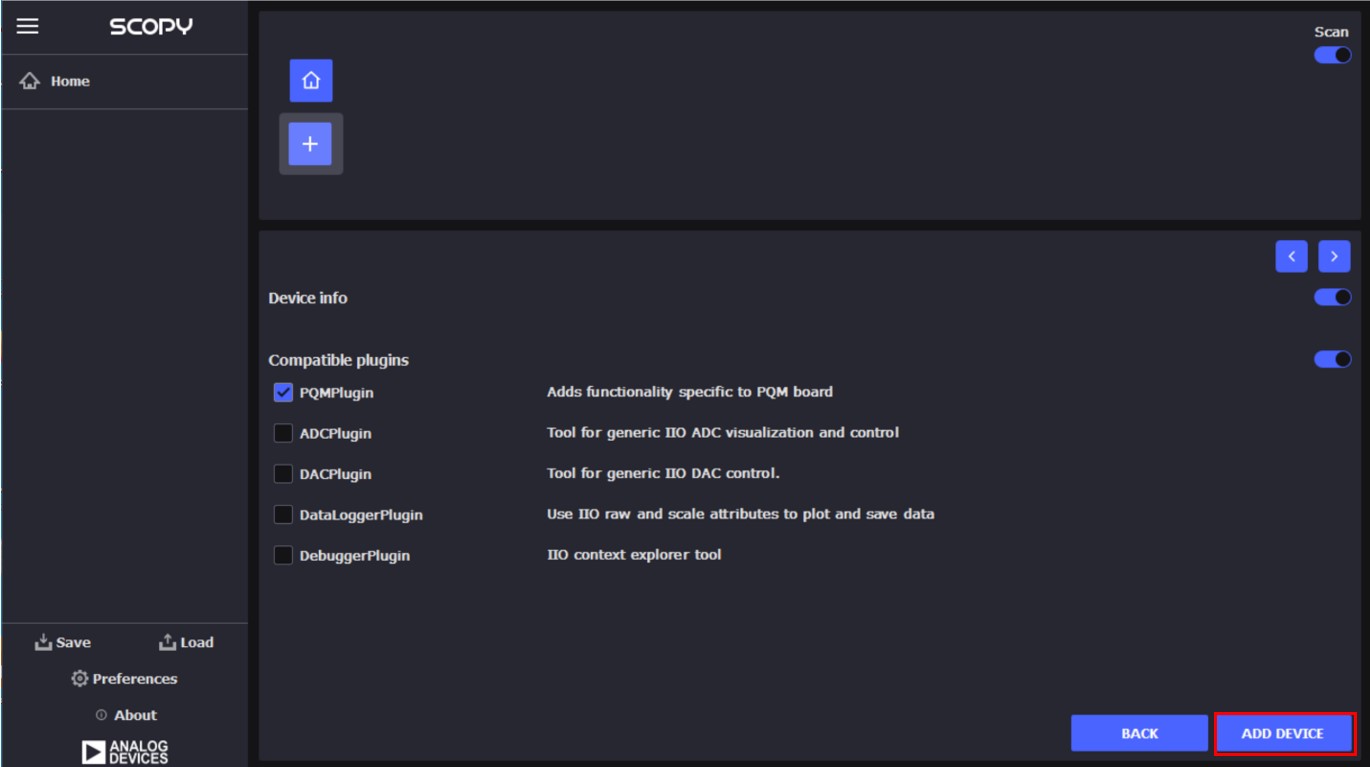
In the next window, click the
Connectbutton.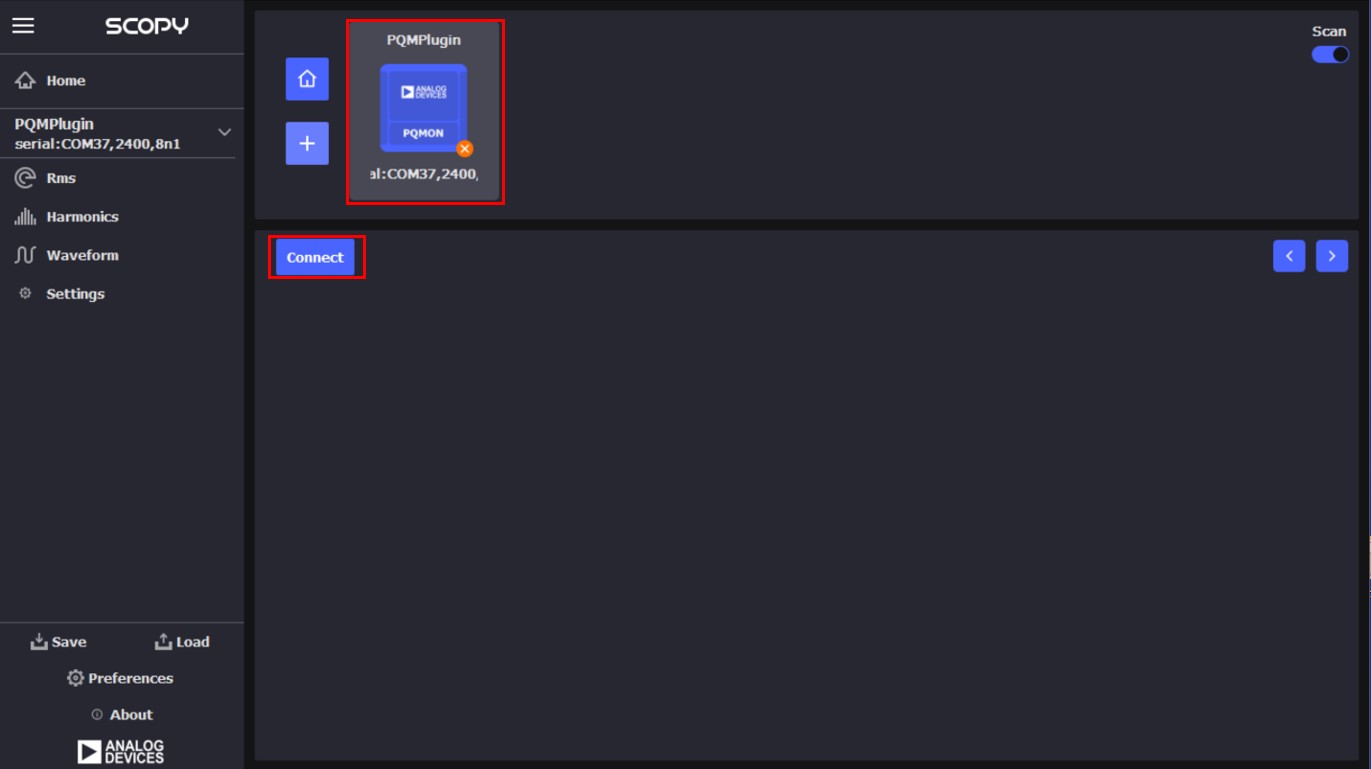
A confirmation message, as shown in the following image, indicates a successful connection.
Measurements
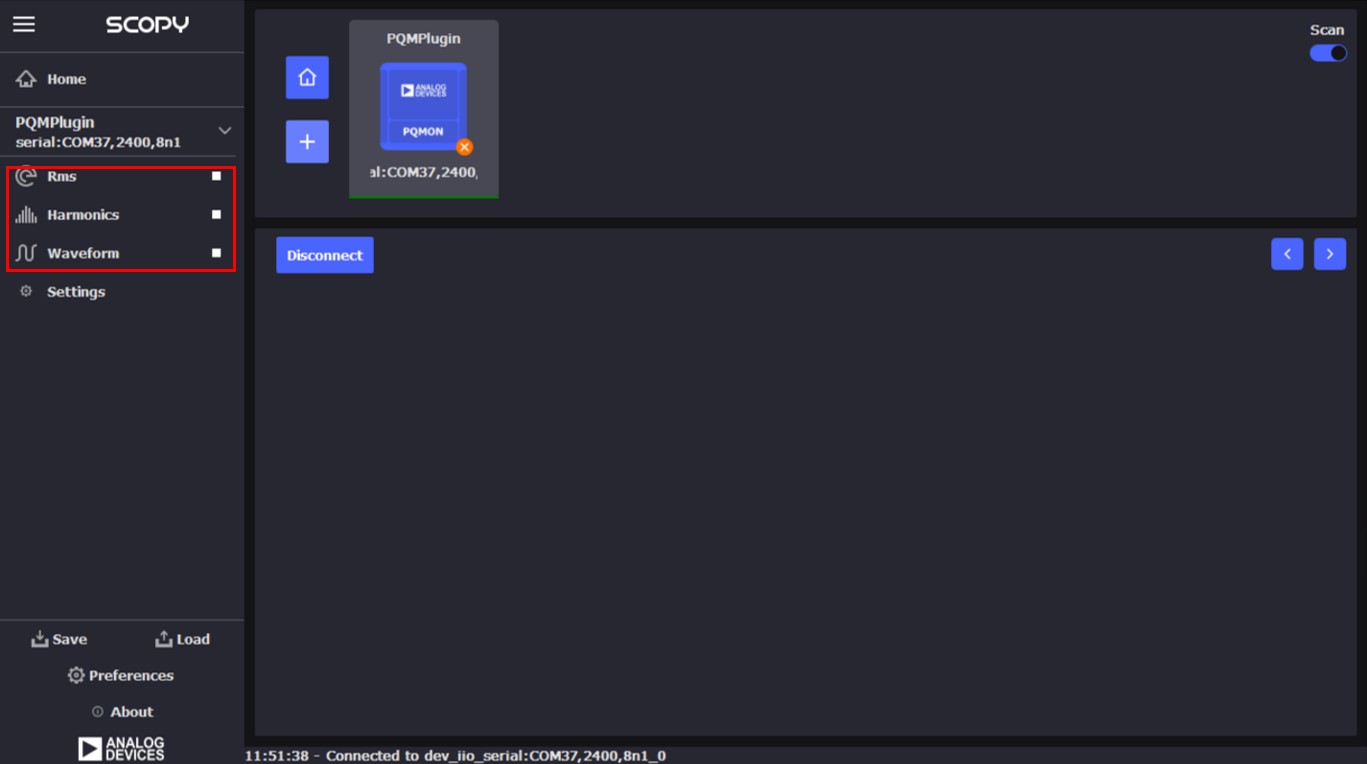
The measurements tabs are available on the left side of the GUI:
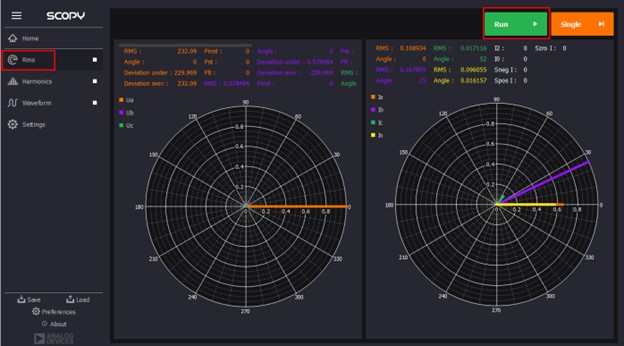
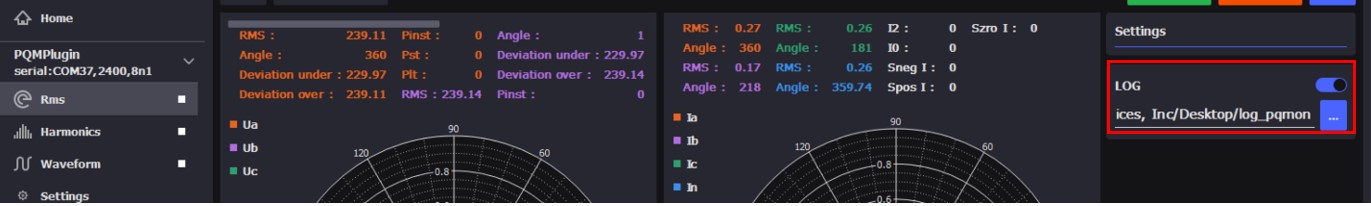
RMS Tab
The RMS tab can be activated by clicking on it and then selecting the Run button.
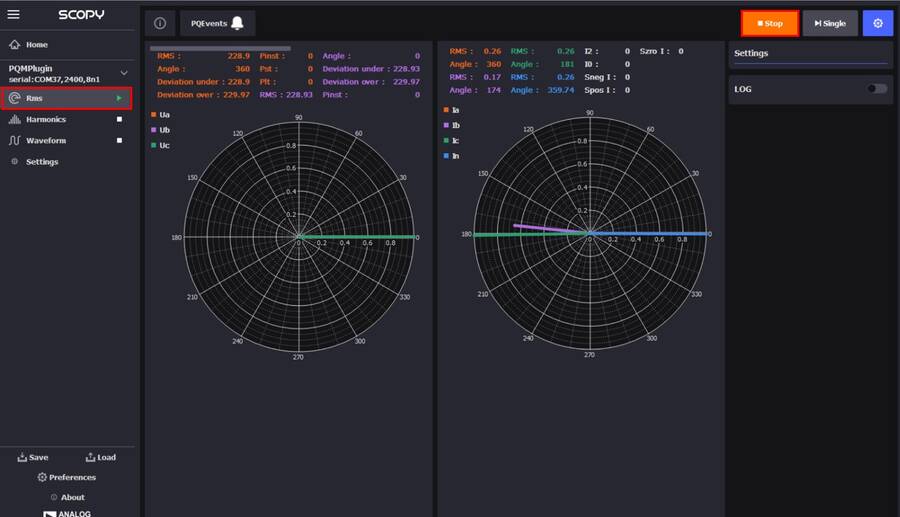
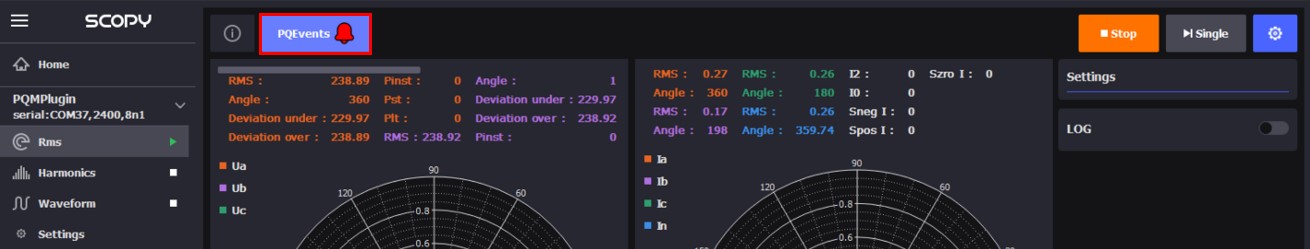
The PQEvents indicator notifies the user when a PQ event has occurred. Events are saved in the log file if logging is enabled.
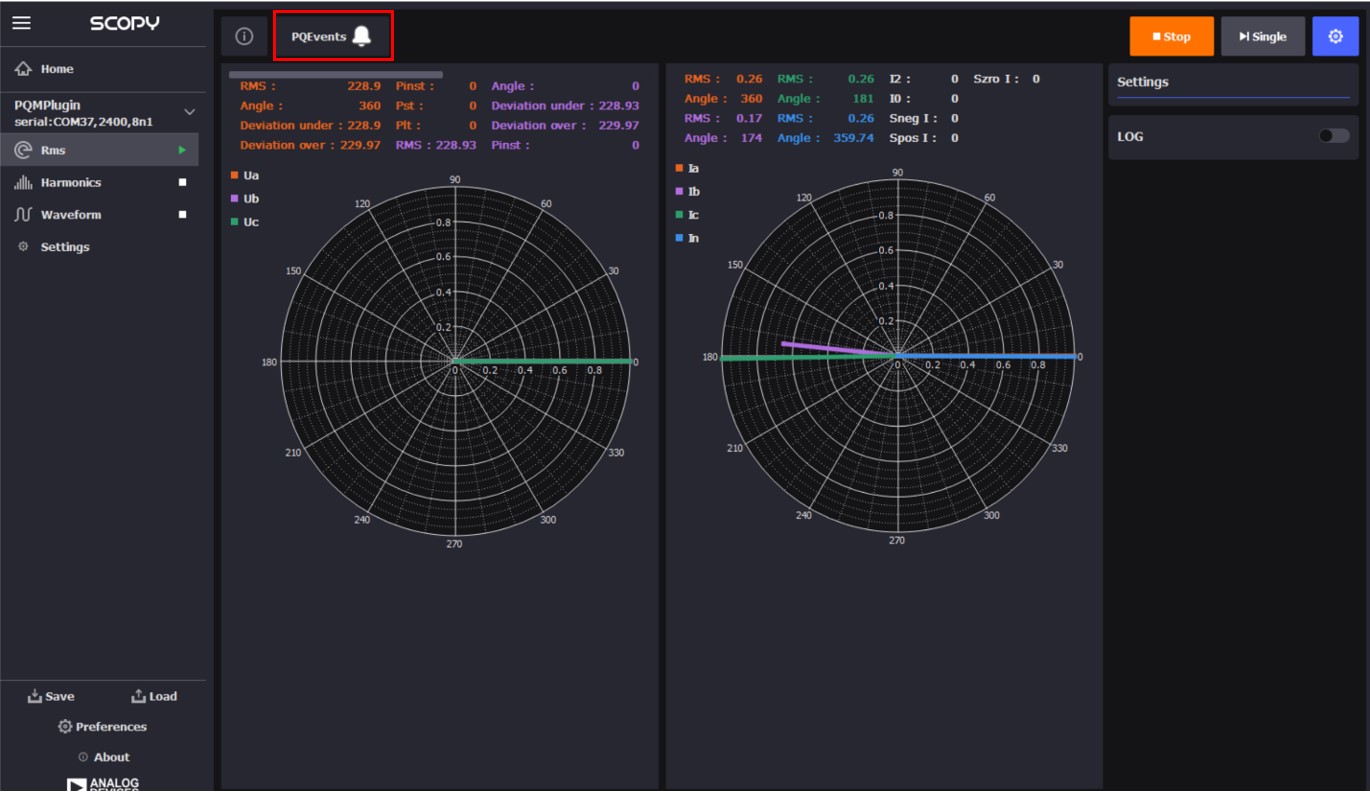
If an event occurs during the session, the PQEvents indicator will become active. The event details can be found in the log file (in the RMS tab, only PQ events are logged). The indicator remains active until the user clicks on it, which resets the indicator. Even if the indicator is not reset, any new event will be registered in the log file.
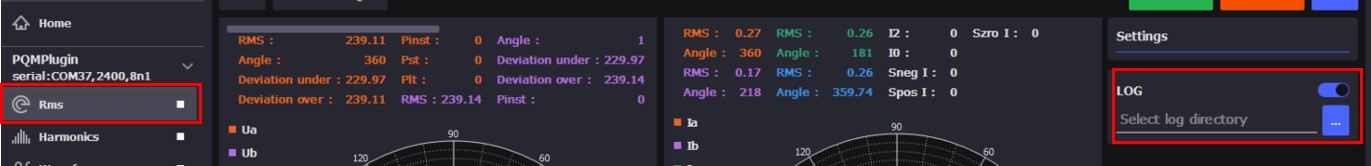
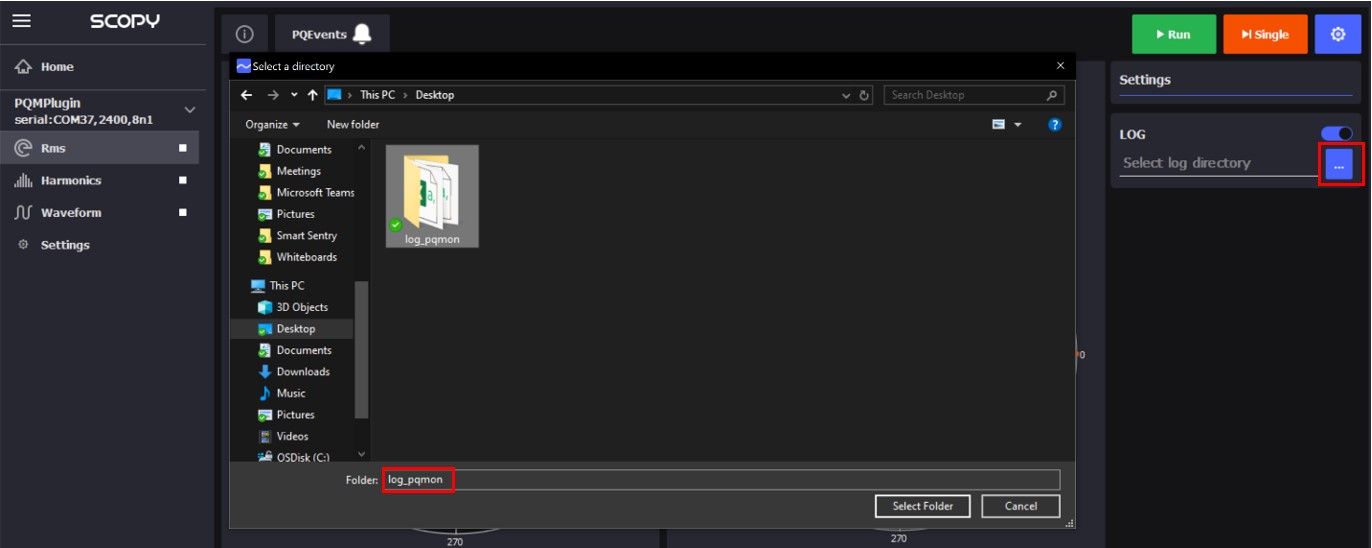
Logging can be enabled only when the measurement is not running. First, select the LOG button. Then, specify a log directory by clicking the button highlighted in the following image.

Choose a folder where the data will be saved in CSV format. The file will be named as follows: “nameofactivewindow_date_time.csv” (e.g. rms_01-01-2024_11-00-00).
After the folder is selected, data will be recorded during a session. The session starts when the Run button is activated and ends when it is stopped.
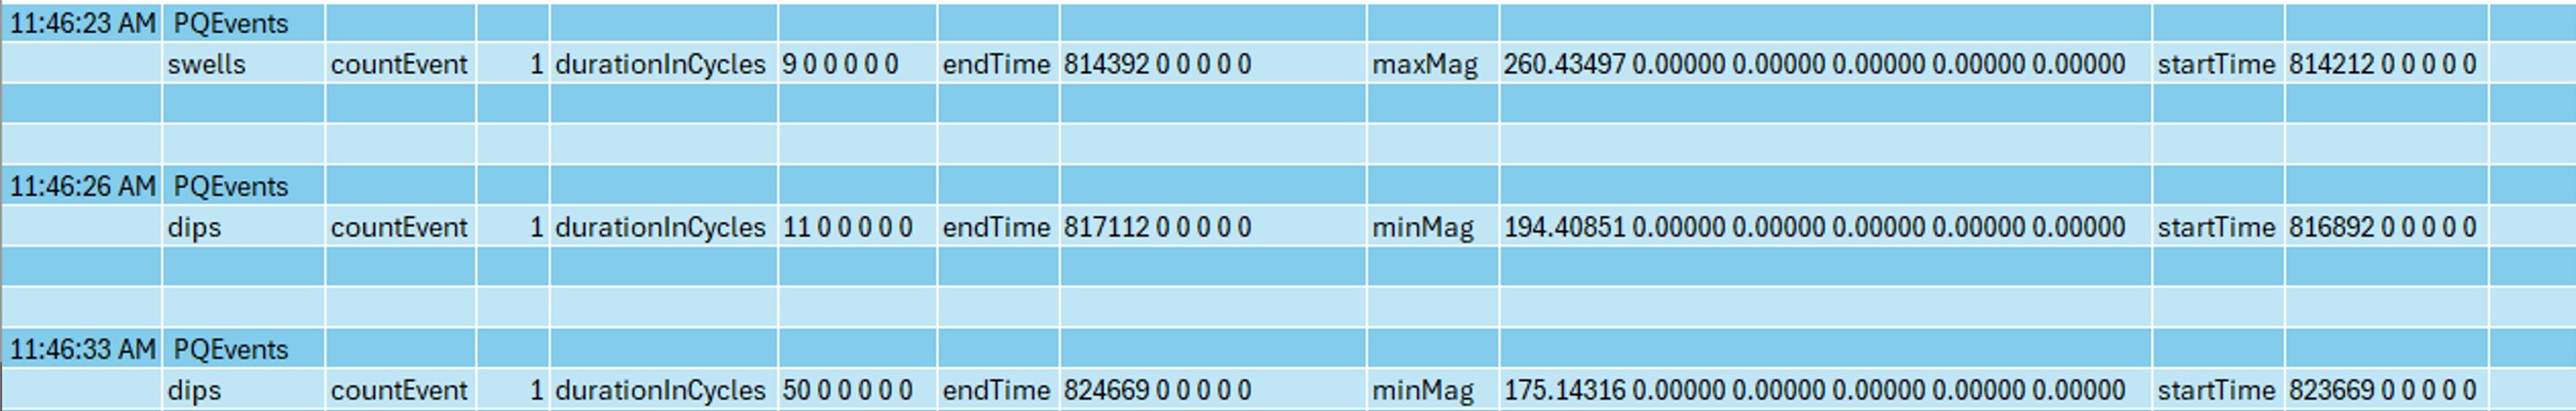
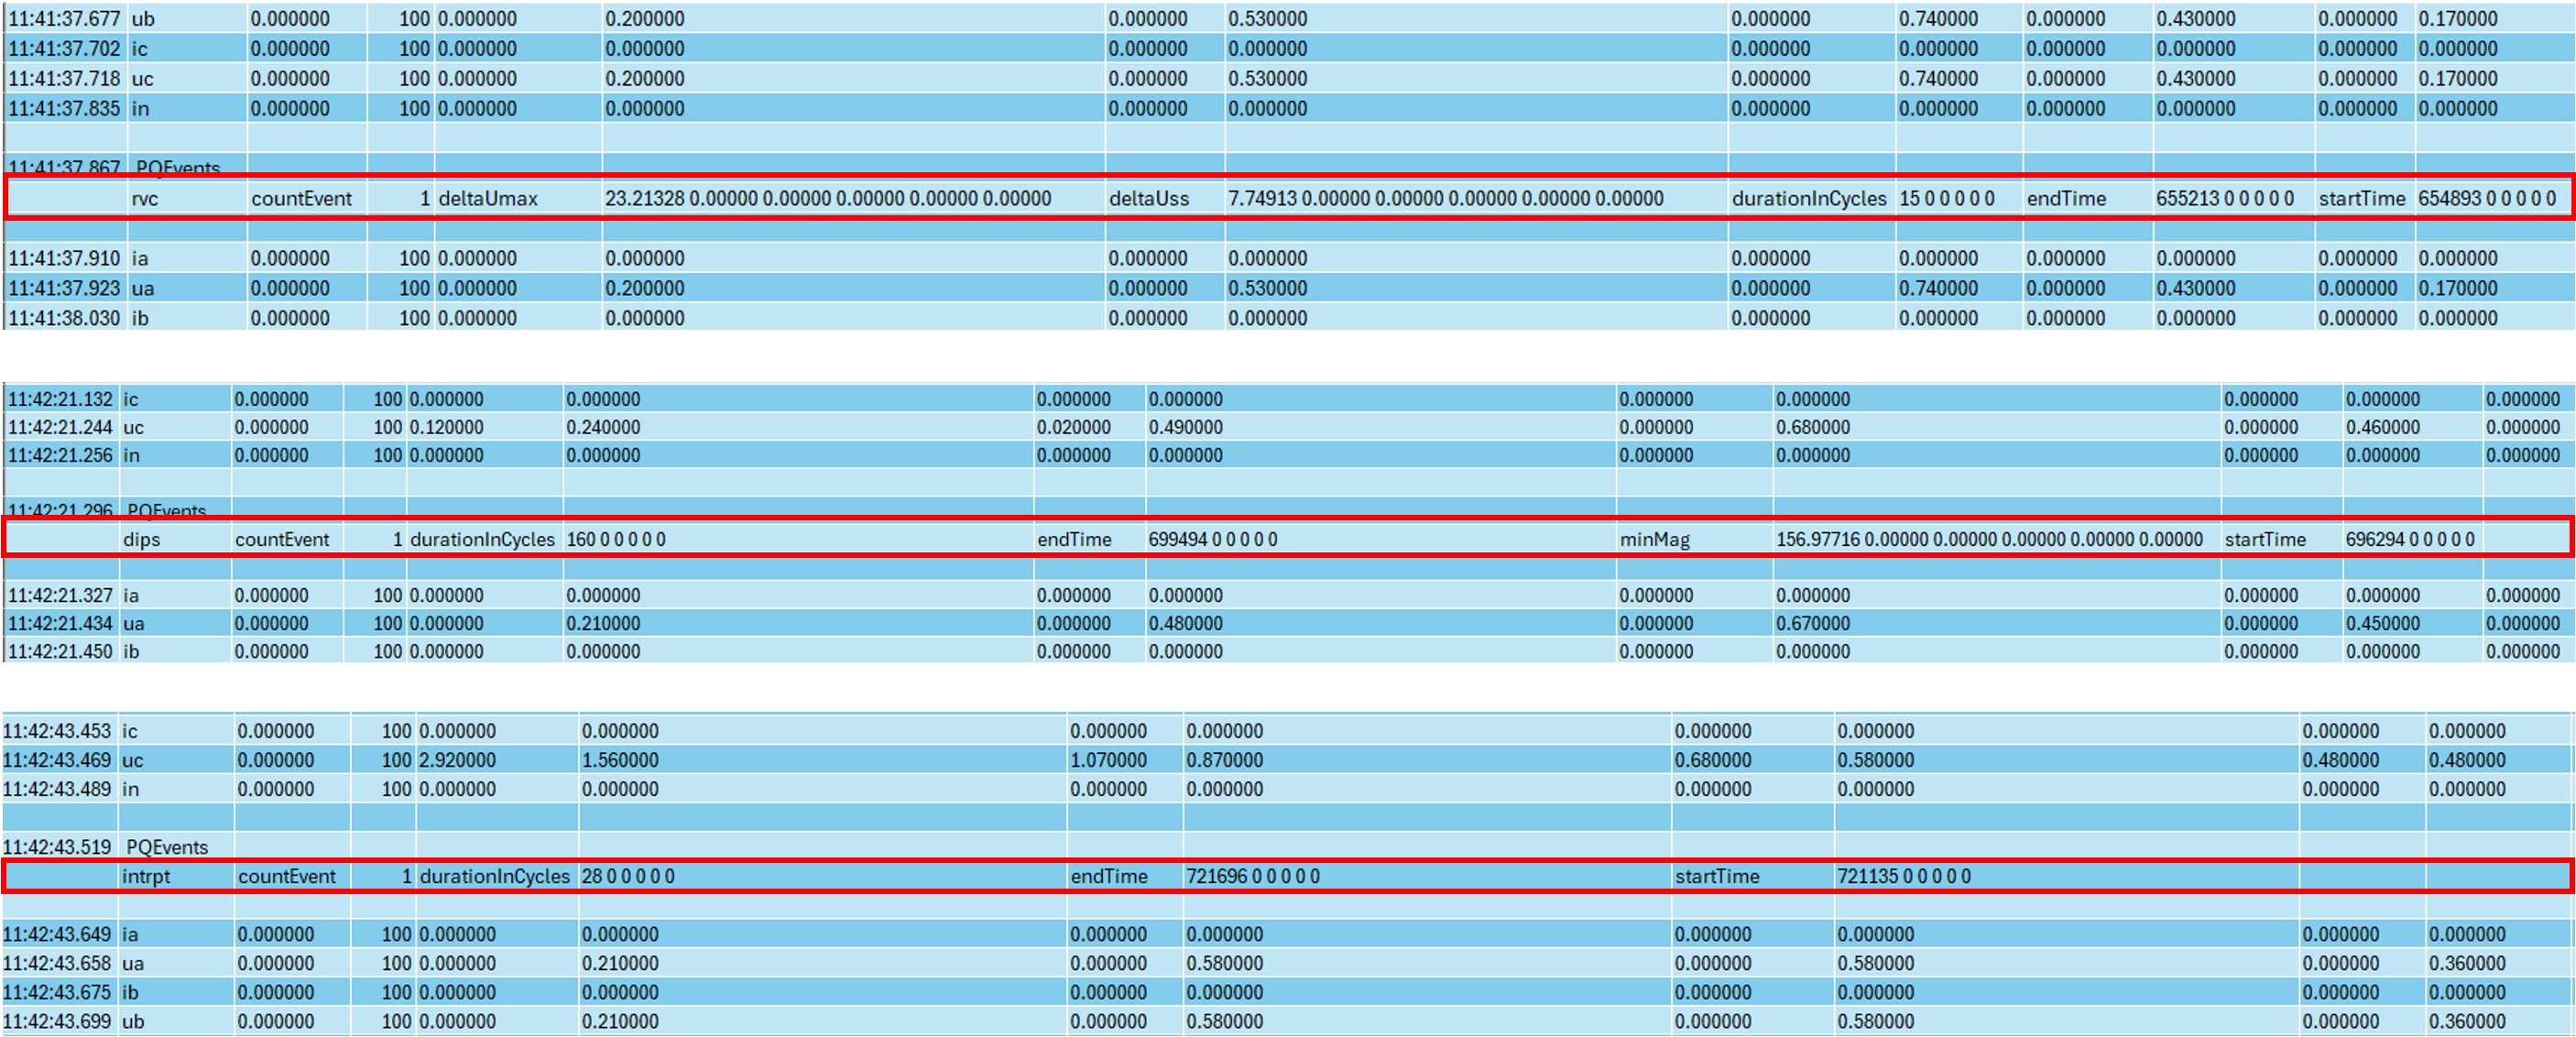
A snapshot of an RMS log file is shown in the following image. As seen, several PQ events occurred during the session.
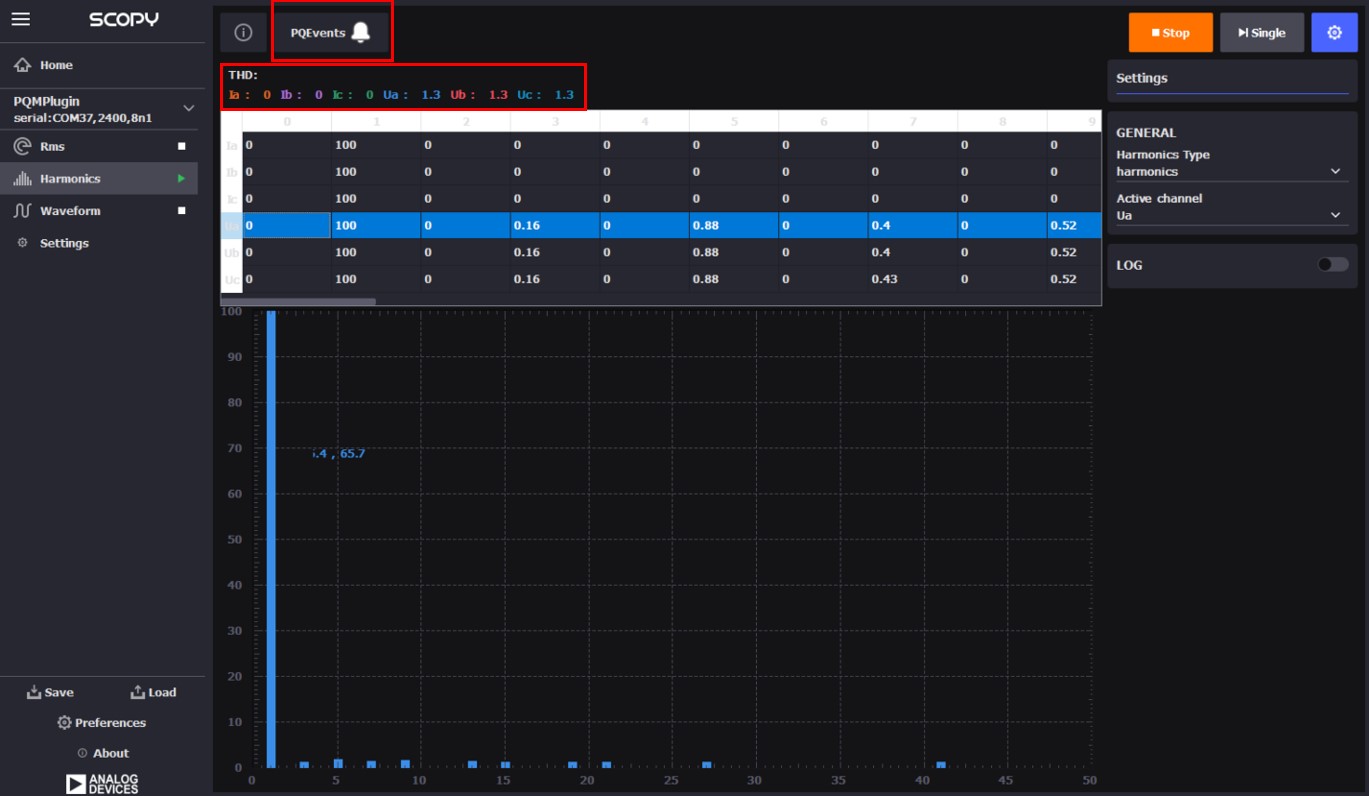
Harmonics Tab
The Harmonics tab can be activated by clicking on it and then selecting the Run button.
To display the harmonics for different waveforms, select the desired line from the table above the graph.
The THD (Total Harmonic Distortion) values are shown for each measurement next to the THD label.
The PQEvents indicator notifies the user when a PQ event has occurred. Events are saved in the log file if logging is enabled.
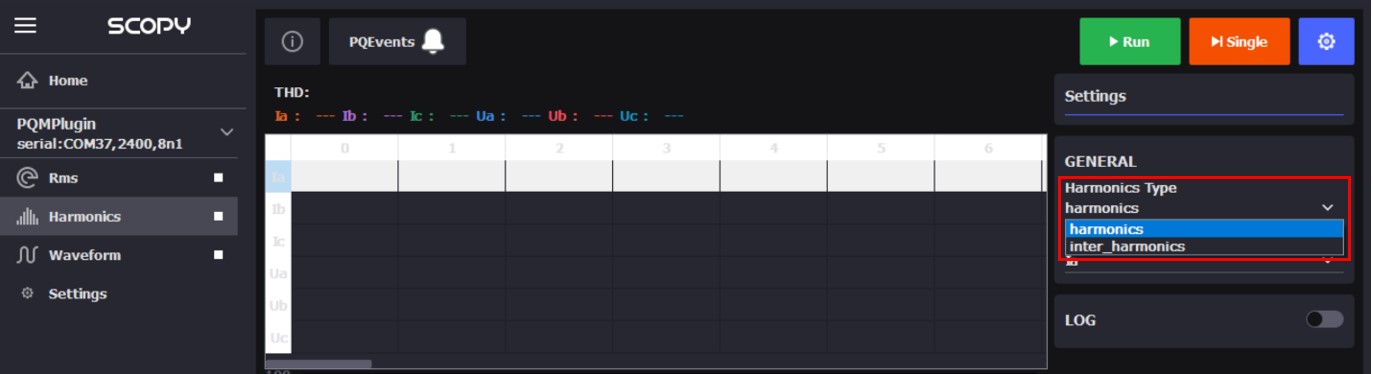
The user can select between viewing harmonics or interharmonics.
Logging can be enabled only when the measurement is not running. First, select the LOG button. Then, specify a log directory by clicking the button highlighted in the following image.
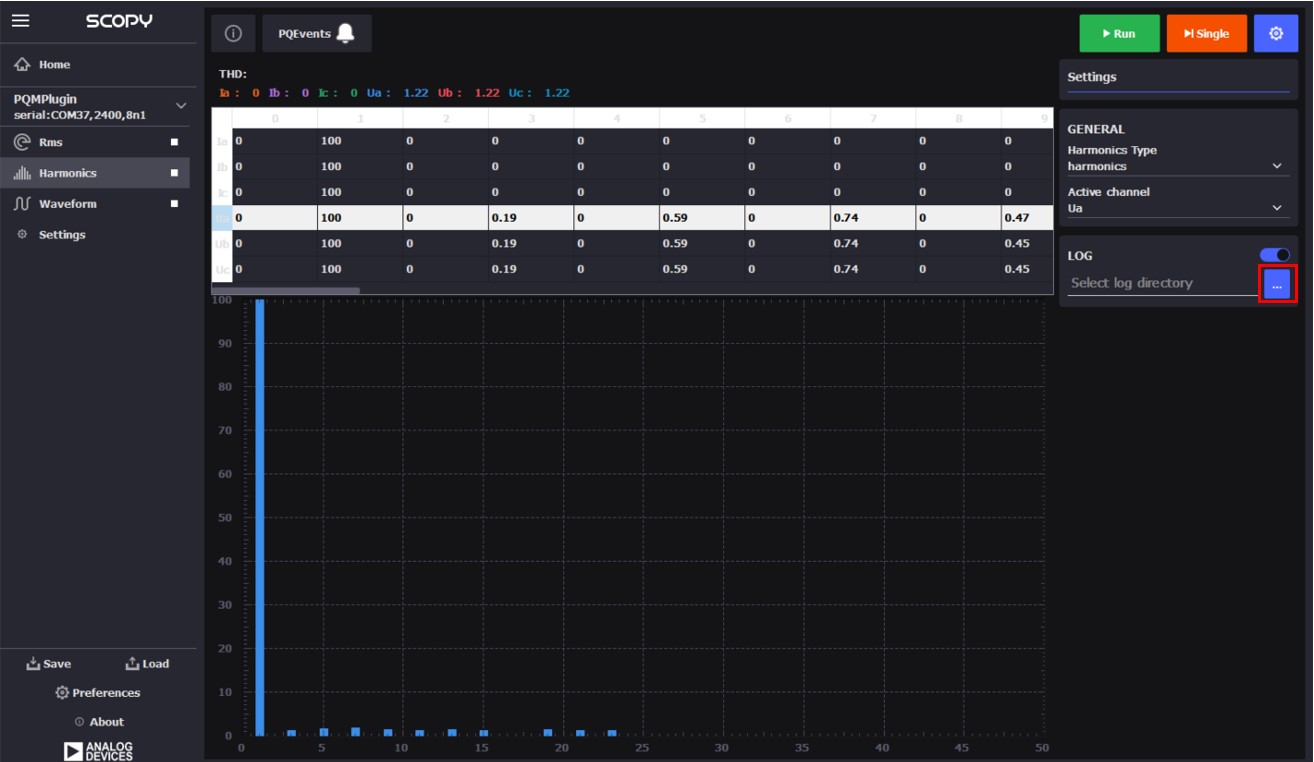
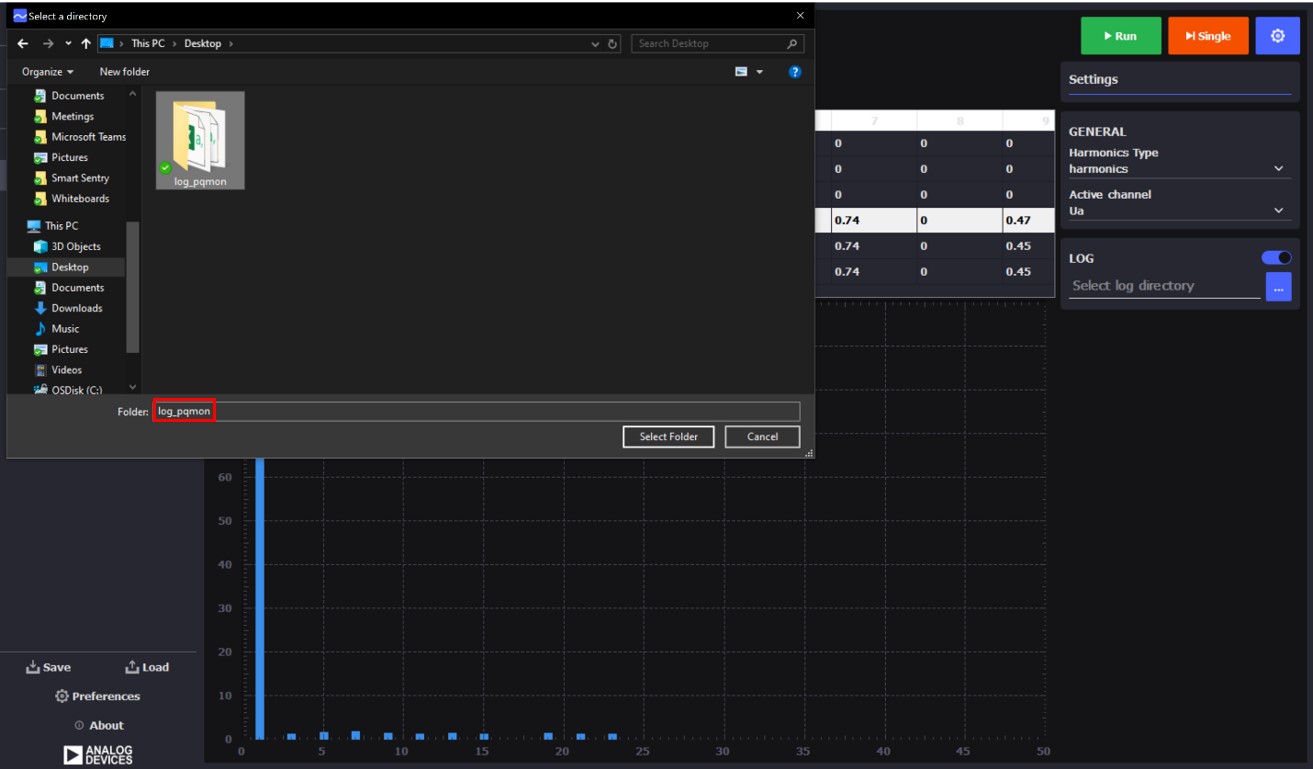
Choose a folder where the data will be saved in CSV format. The file will be named as follows: “nameofactivewindow_date_time.csv” (e.g. harmonics_01-01-2024_11-00-00).
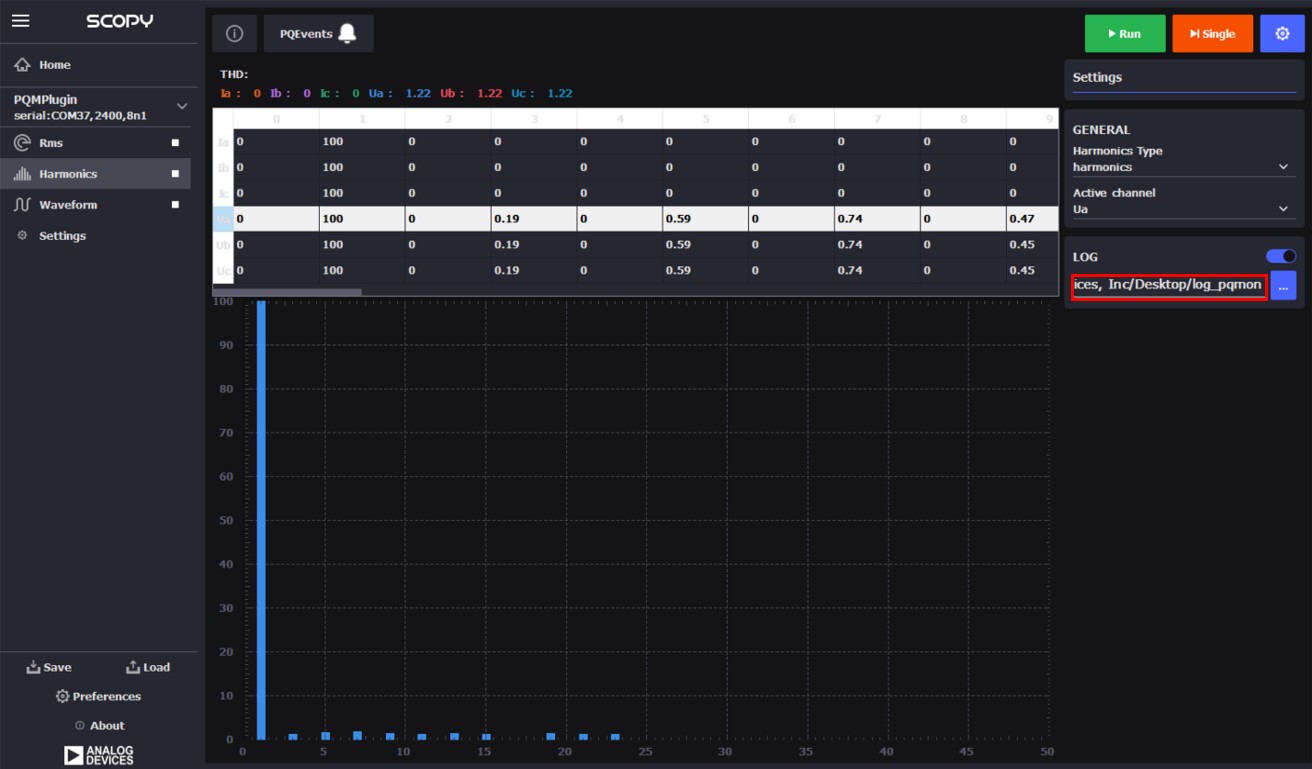
After the folder is selected, data will be recorded during a session. The session starts when the Run button is activated and ends when it is stopped.
If an event occurs during the session, the PQEvents indicator will become active. The event details can be found in the log file. The log file in the Harmonics tab contains both the harmonics values and the PQ events, interleaved at the time the event occurred. The indicator remains active until the user clicks on it, which resets the indicator. Even if the indicator is not reset, any new PQ event will be registered in the log file.
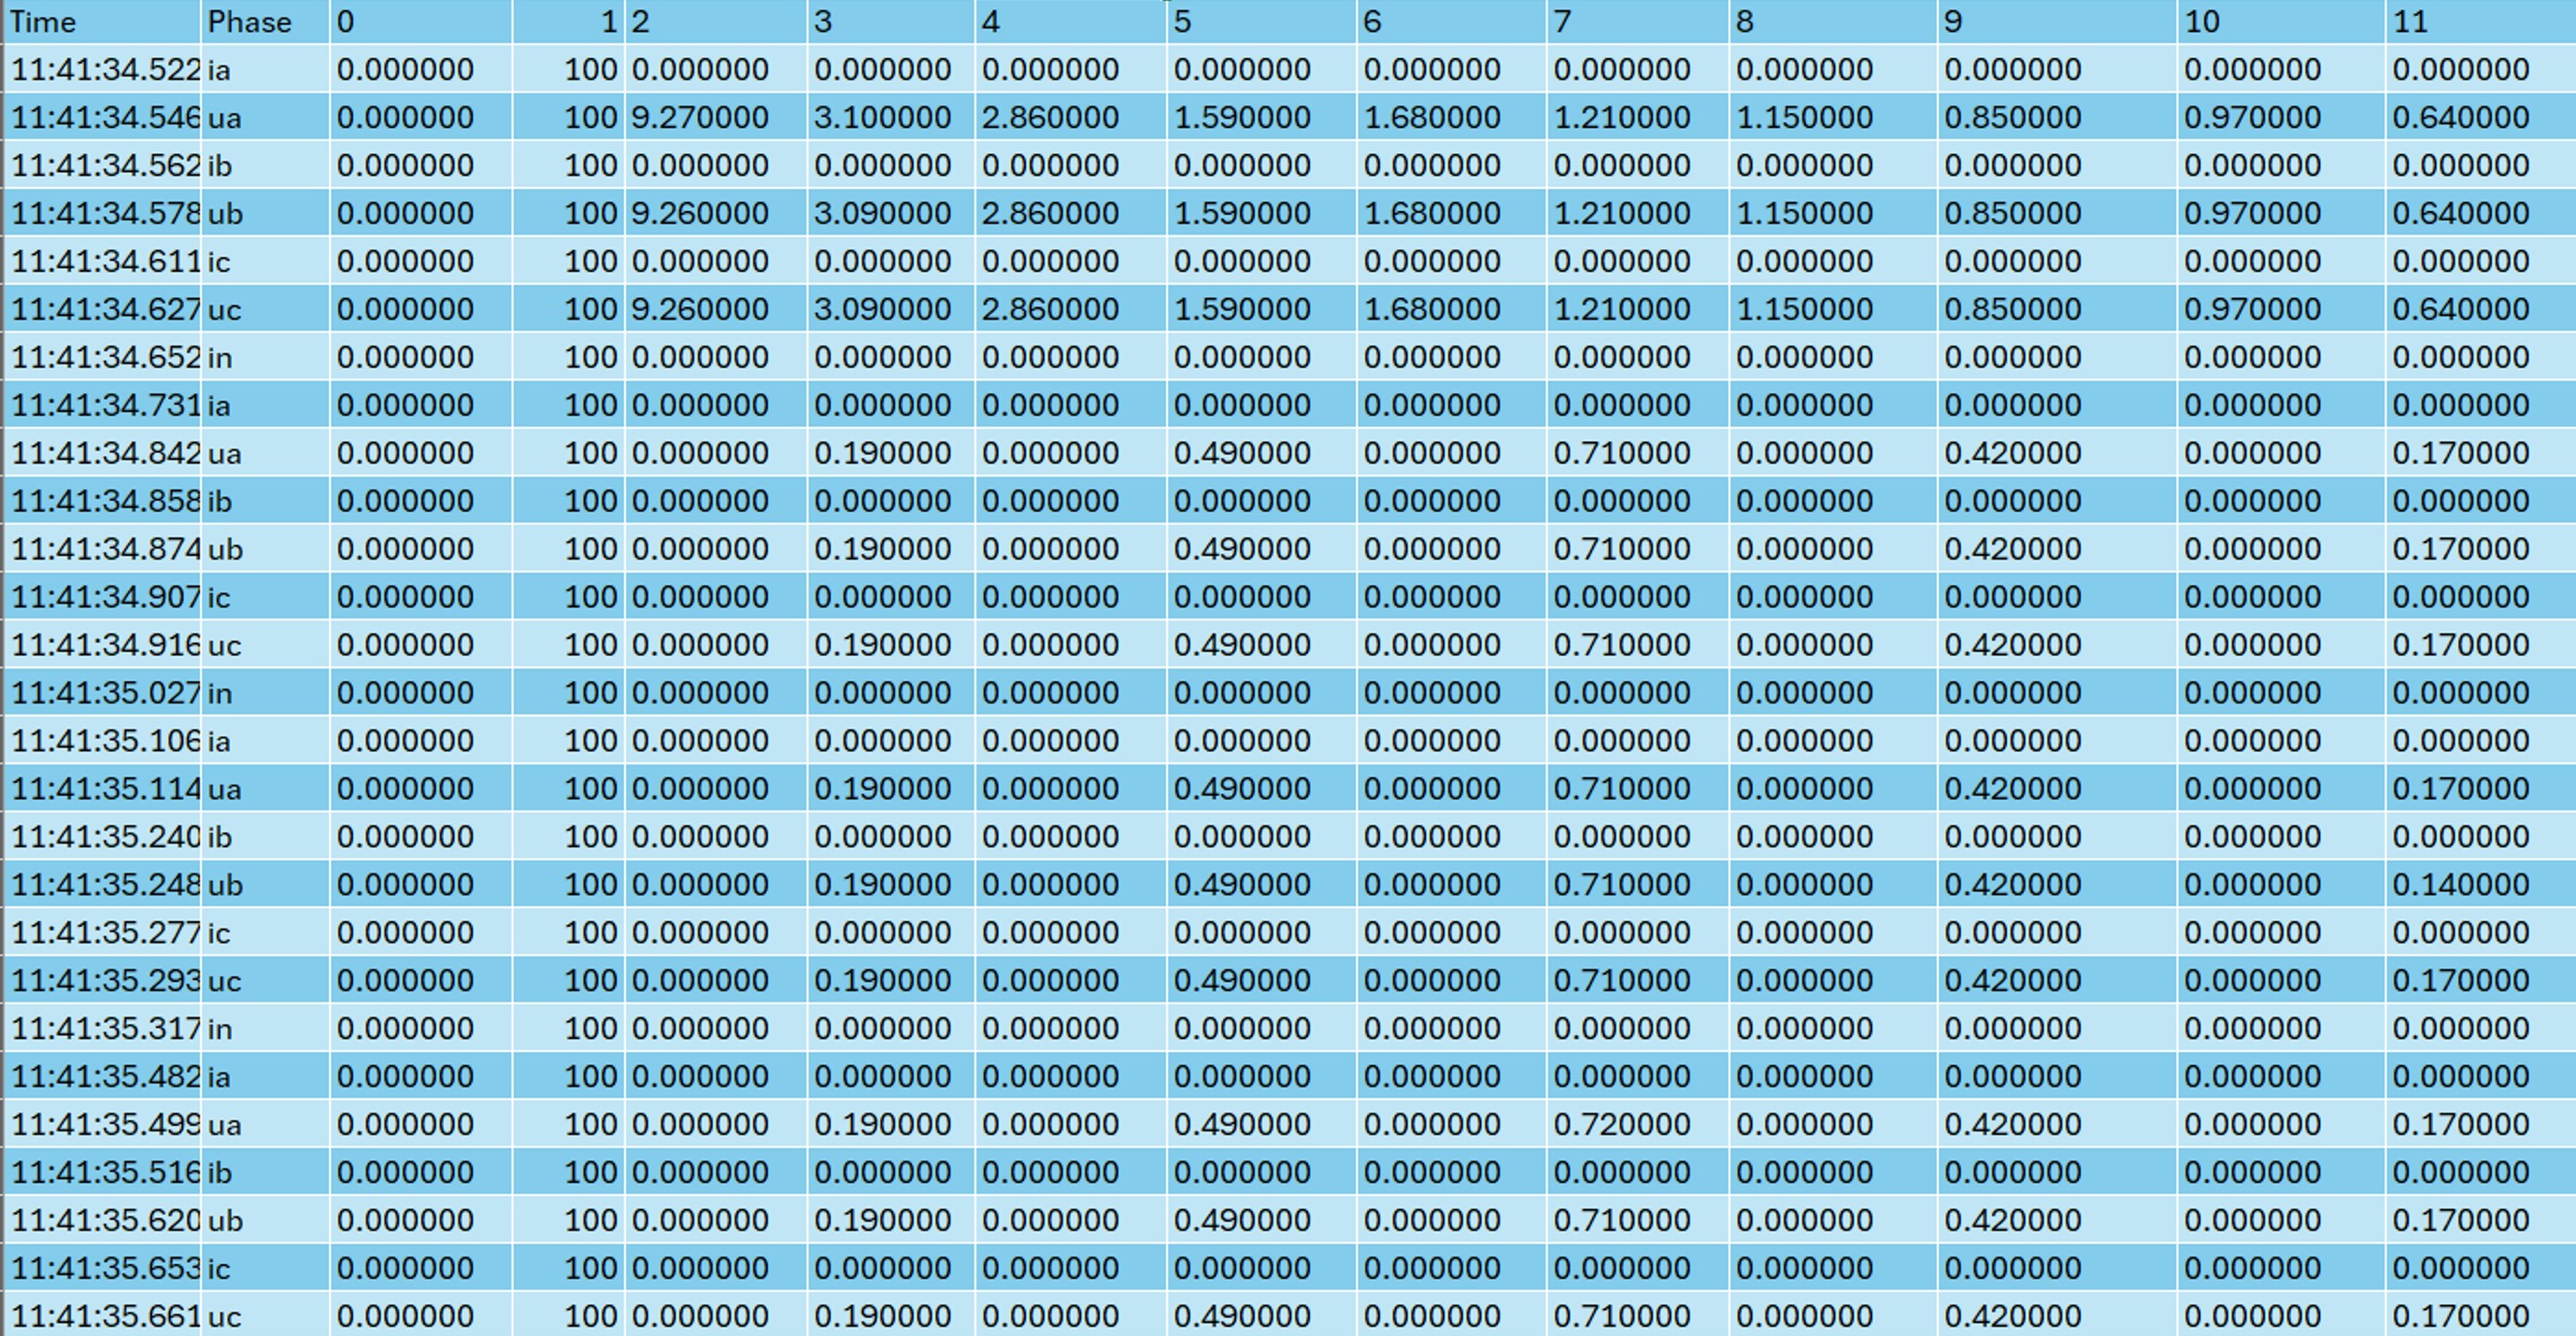
A snapshot of a harmonics log file containing only harmonics data is shown in the following image.
In the following snapshot, PQ events can be seen interleaved with the harmonics values.
Waveforms Tab
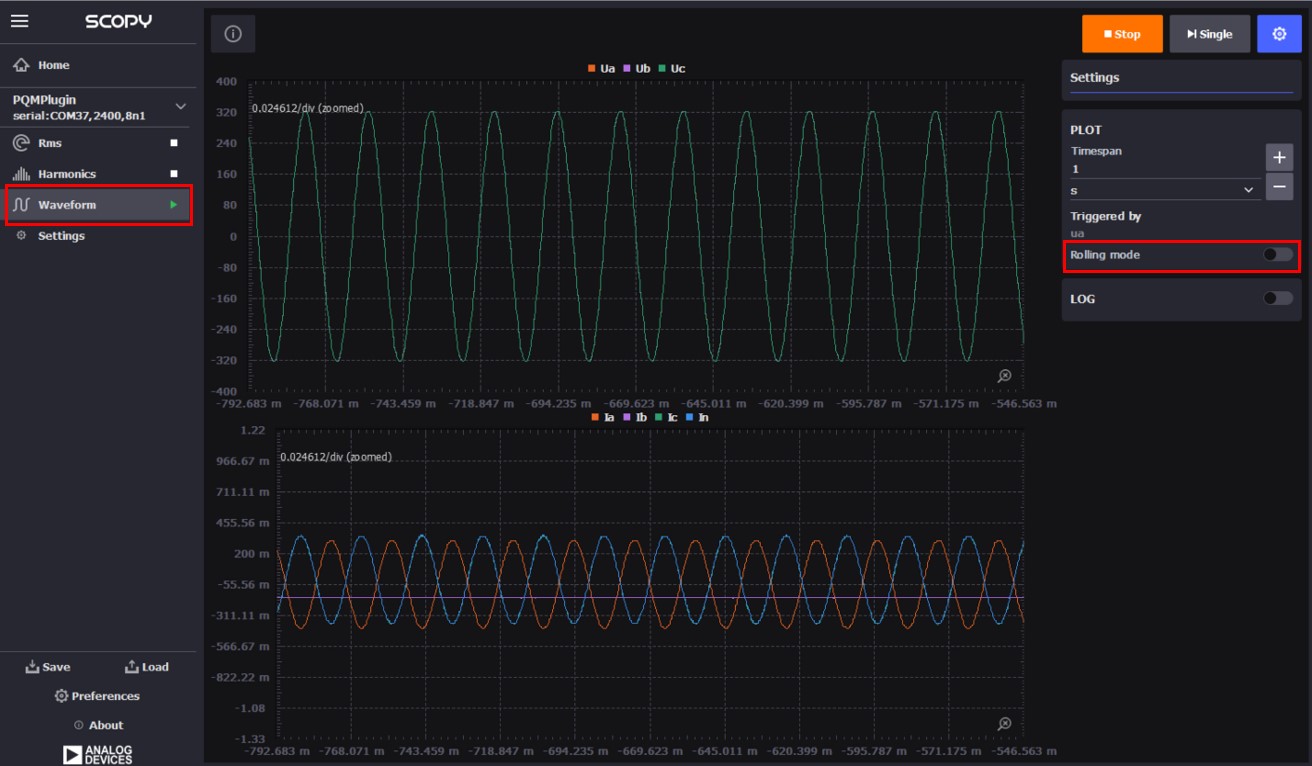
The Waveform tab can be activated by clicking on it and afterwards select the Run button.
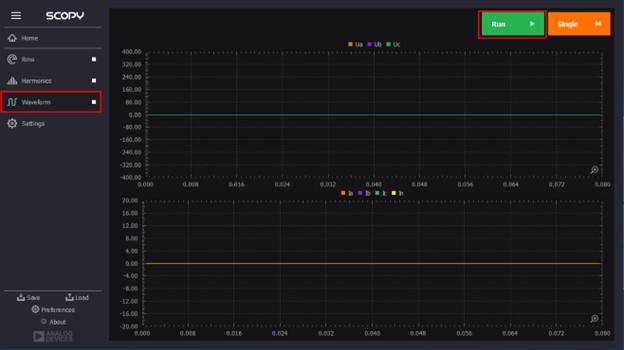
The upper side graph is the voltage and the one to the bottom is the current. To zoom in use the mouse to click and drag.
The log file can also be activated in the waveforms tab in the same manner explained in the rms or harmonics sections, but in this case the PQ events is not present. If PQ events need to be recorded, then the other two tabs (rms, harmonics) must be used. The data logged in this tab contains only the waveforms values.
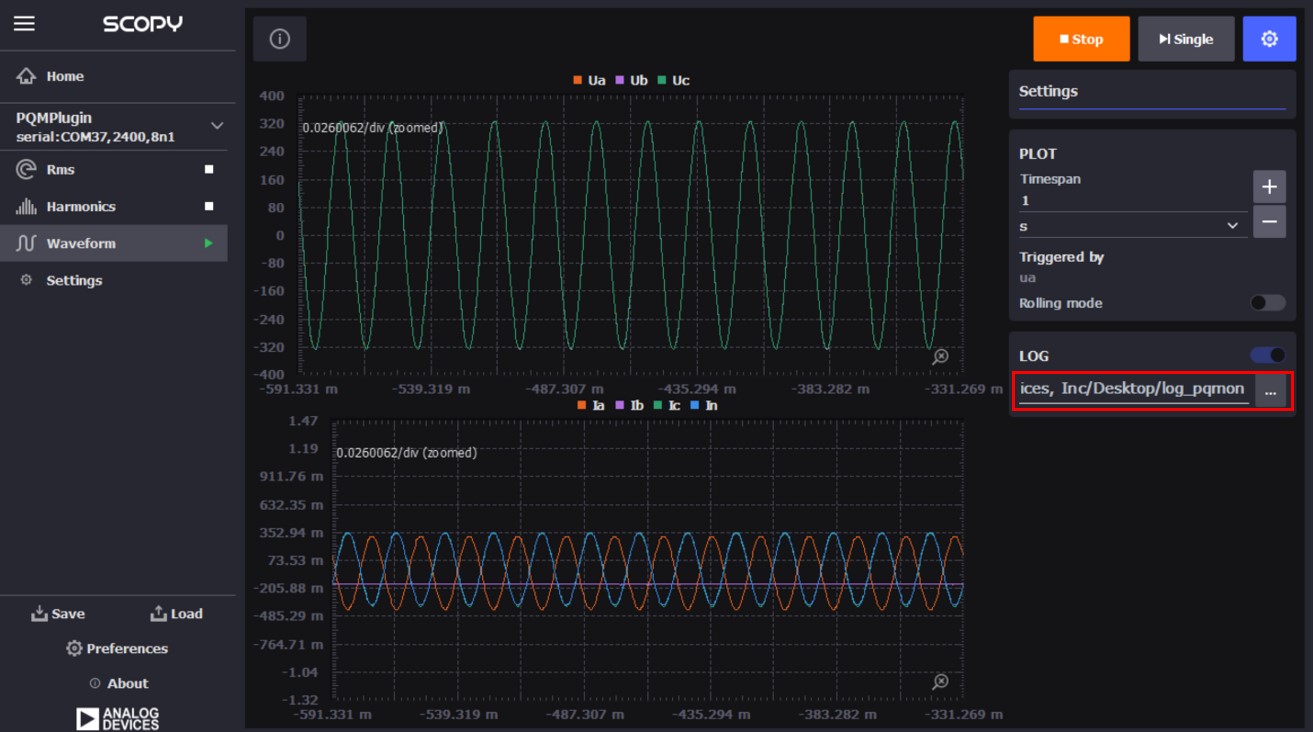
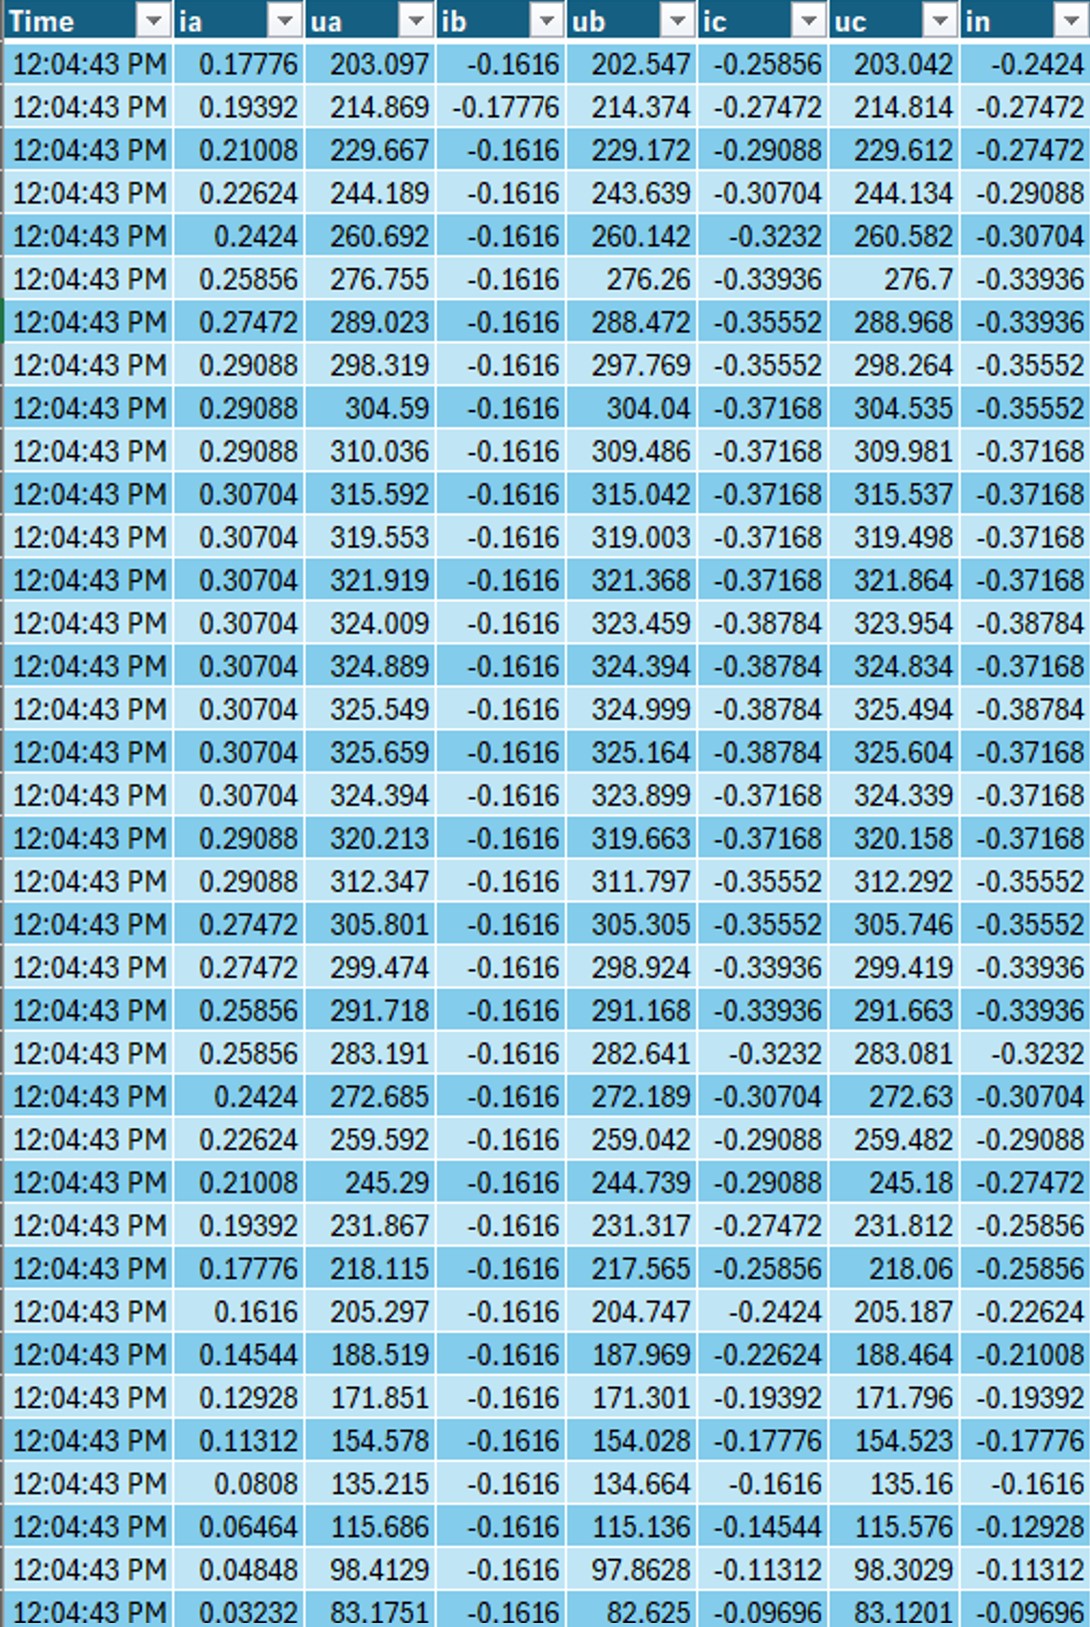
A snapshot of a log file can be seen in the following image.
Settings Tab
The Settings tab is used to read and set the thresholds and the config values. Activate it by selecting it from the right-side menu.
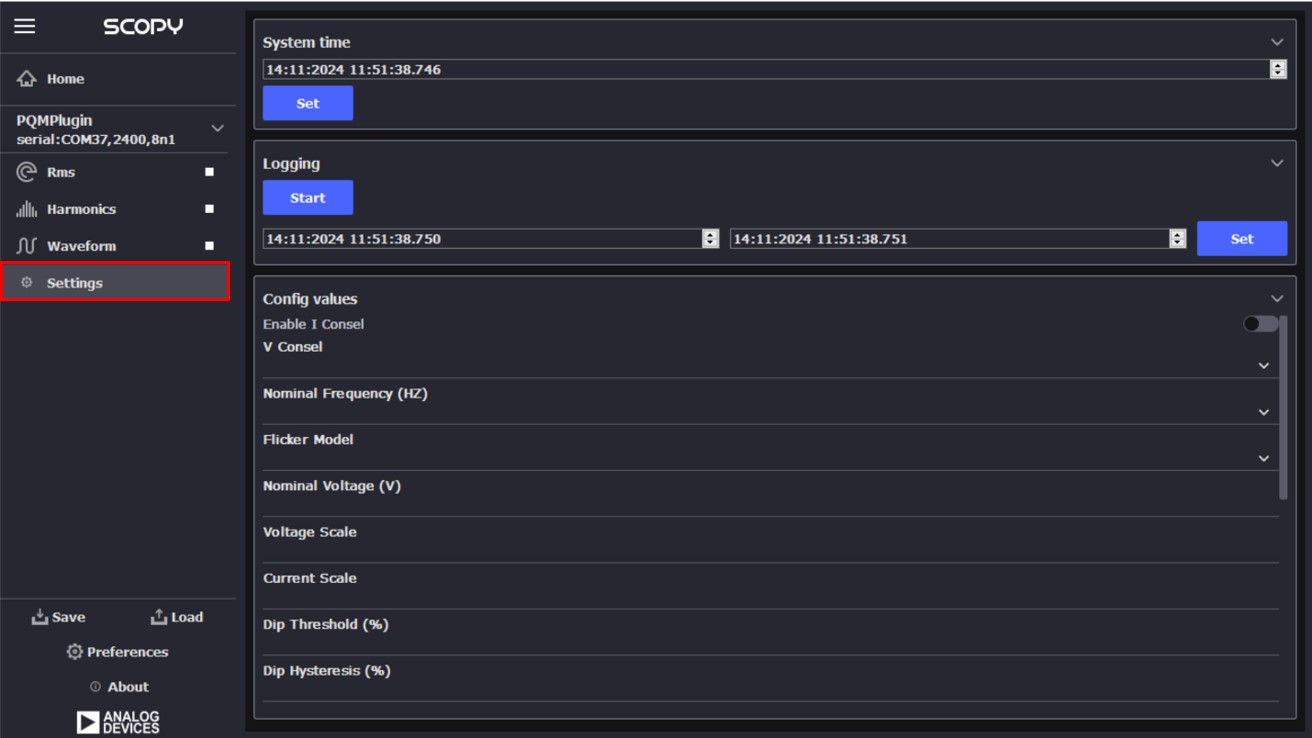
To see all the parameters scroll down
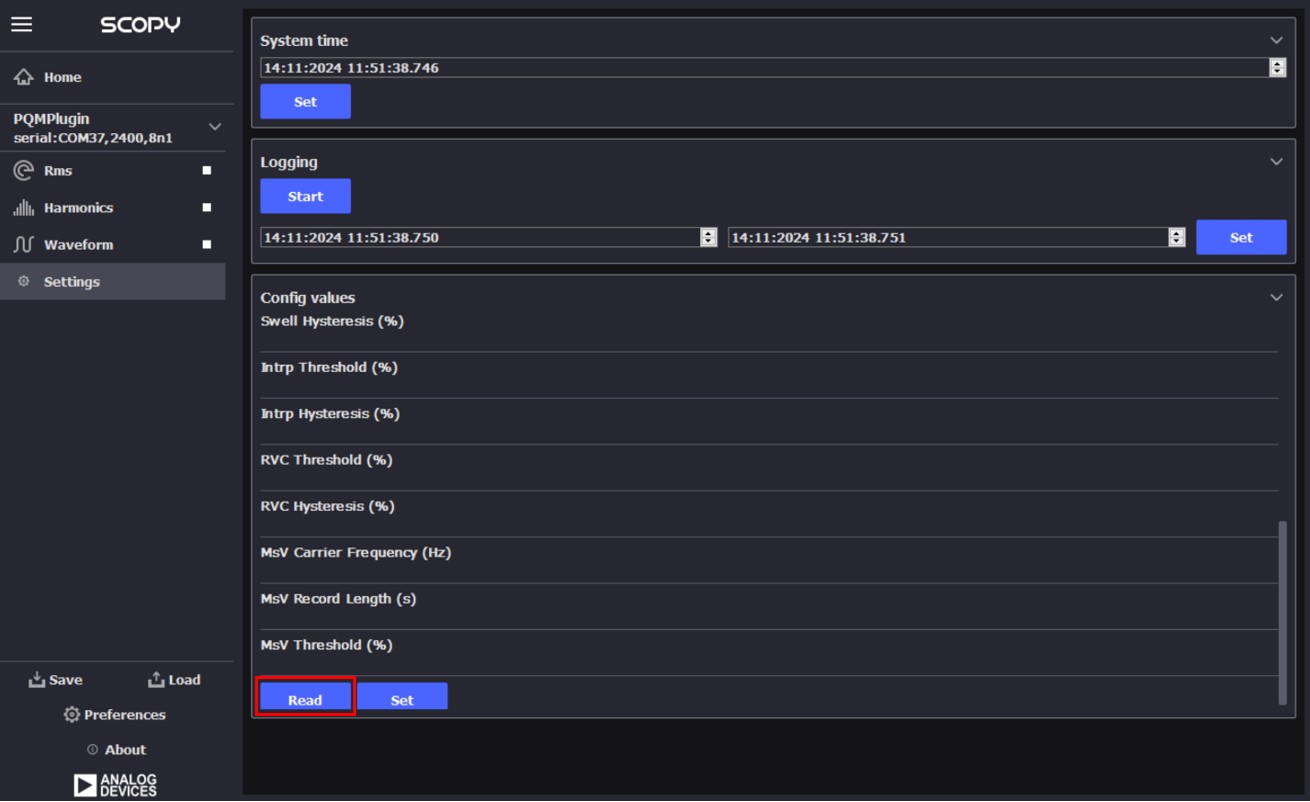
To read the values that are currently set click the Read button.
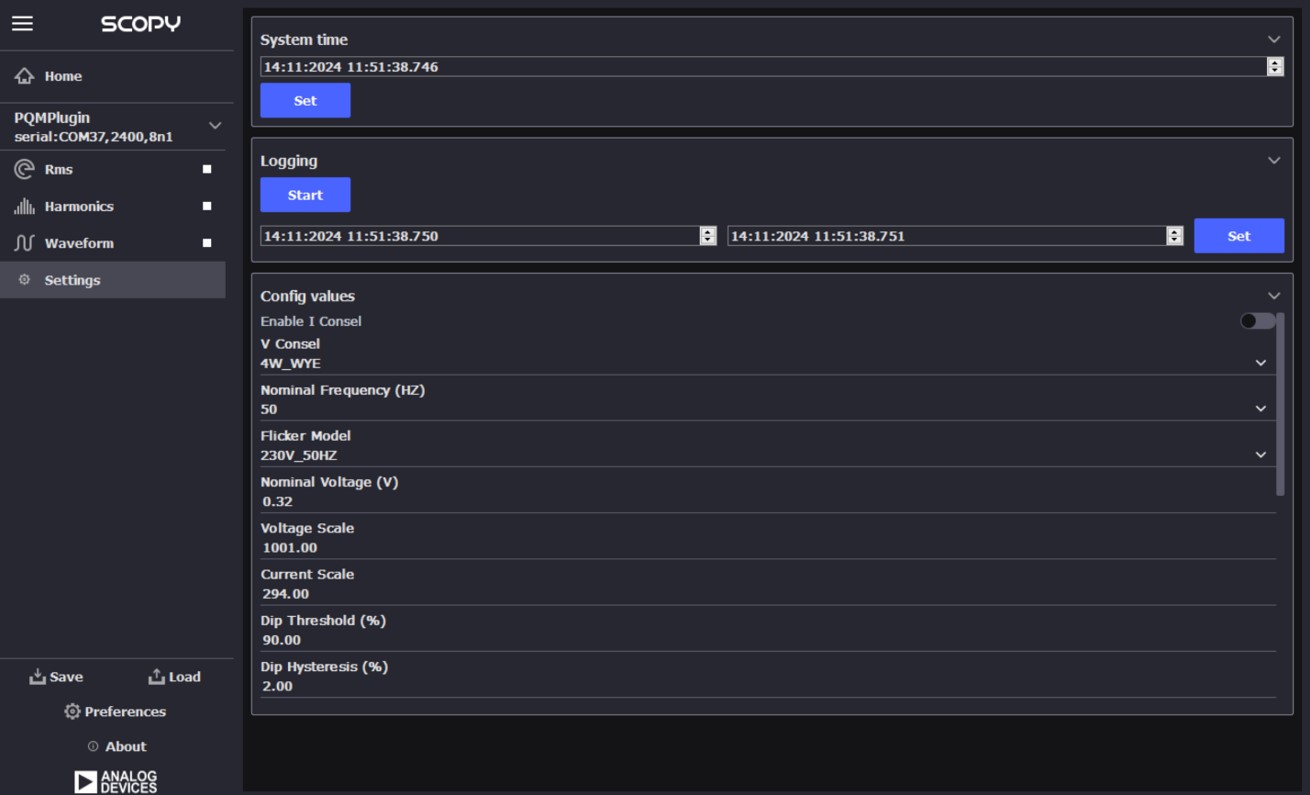
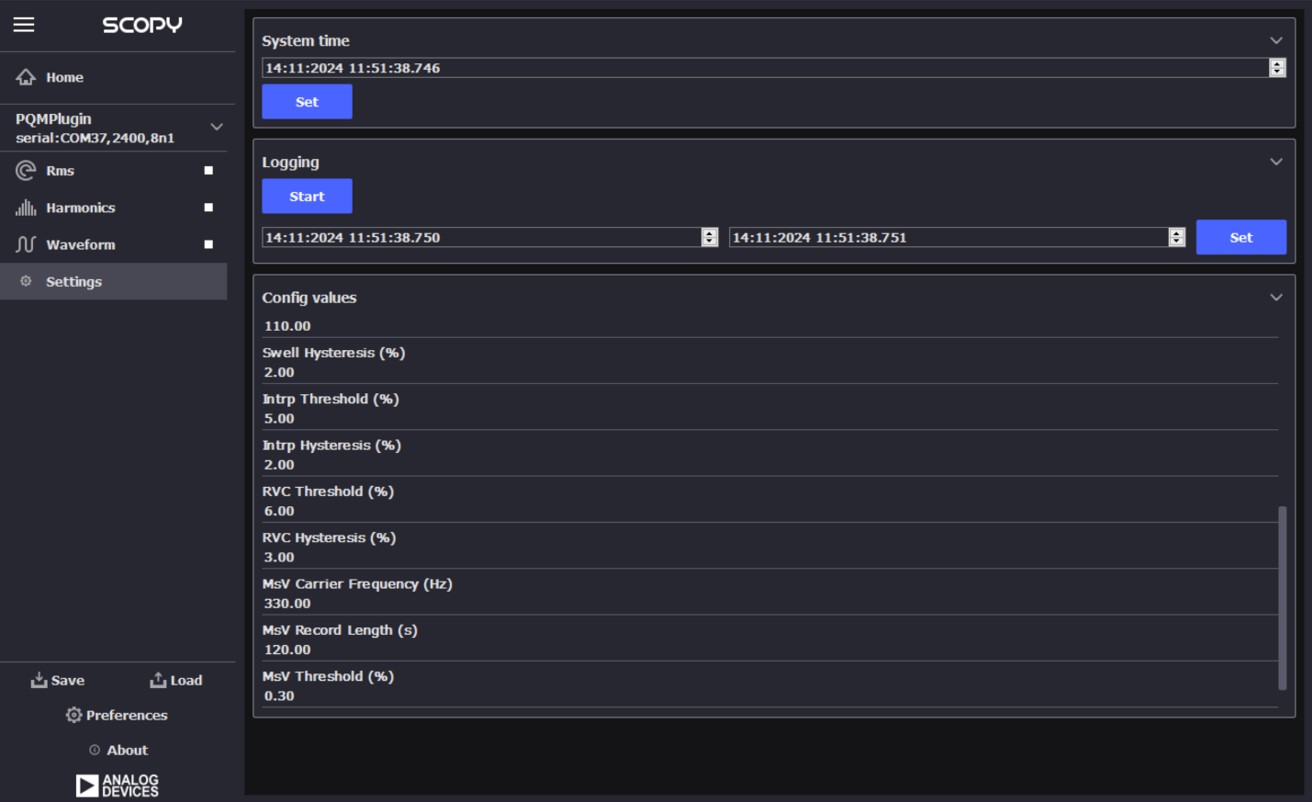
To modify a parameter select it, change its value to the desired one and click the Set button.
Tip
More information about the Scopy PQMON addon can be consulted here
The system comes pre-programmed with a firmware that works with the Scopy application, allowing complete system evaluation.
Scopy will work only with the official firmware releases
Firmware Update
Firmware update using a prebuilt hex file
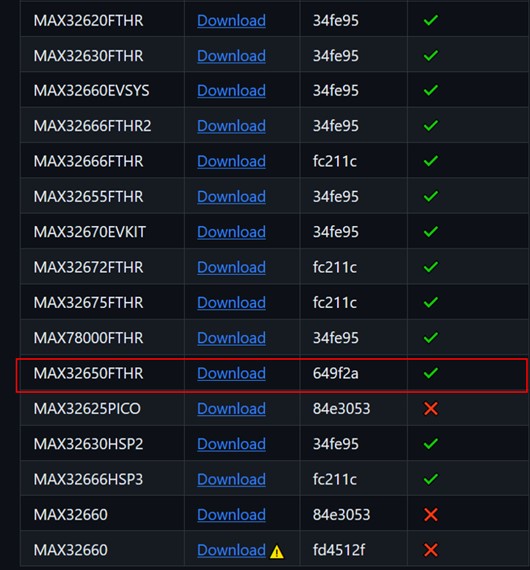
Step 1 - MAX32625PICO Firmware Update
Download the MAX32650FTHR firmware image from here
Follow the procedure indicated here to load the new firmware.
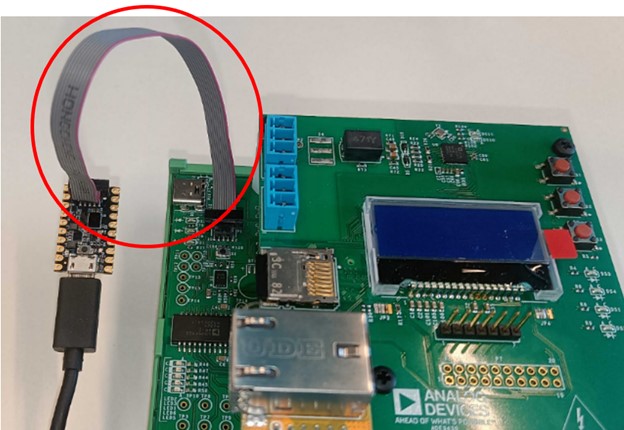
Step 2 - Connect the MAX32625PICO to the AD-PQMON-SL Board
Connect the Cortex Debug Cable to the MAX32625PICO with the connector key directed towards the outside of the board.
Connect the programmer to the board as shown in the following picture.
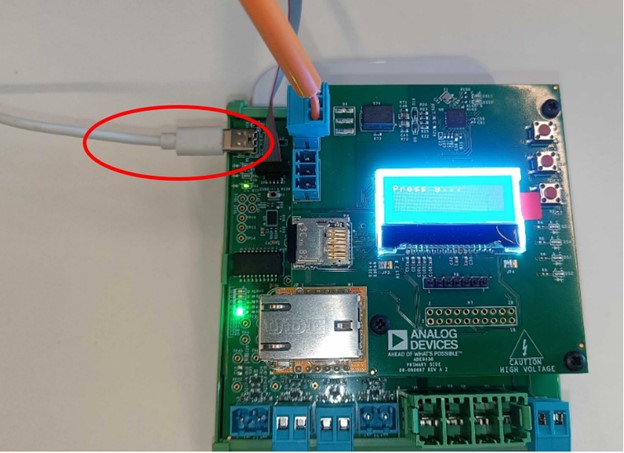
Step 3 - Power up the board by connecting the USB type C cable
Step 4 - Flashing the firmware to the AD-PQMON-SL
If the MAX32625PICO is not connected to the PC USB port, connect it now.
Once connected, the DAPLINK should appear as a storage device on your PC.
Open the DAPLINK storage device.
Drag and drop the provided .hex file into the DAPLINK drive. The firmware will be written to the target MCU.
Building the Project
Preliminary requirements
The licensed software library that works in conjunction with the ADE9430 IC can be obtained from here.
After obtaining the libraries, the following files need to be added to the project:
pqlib_dir
|  libadi_pqlib_cm4_gcc.a
└───include
    |   ade9430.h
    |   adi_pqlib_debug.h
    |   adi_pqlib_error.h
    |   adi_pqlib_memory.h
    |   adi_pqlib_profile.h
    |   adi_pqlib_version.h
    |   adi_pqlib.h
    └───config
        └───adi_pqlib_cfg.h
It can be integrated into the project by defining the PQLIB_PATH to point to
the pqlib_dir path.
Build and Run
The project is based on a MAX32650 microcontroller. It can be built and run by running the following script:
# remove build directory
make reset
# select platform
export PLATFORM=maxim
# select controller type
export TARGET=max32650
# build and flash the code
make PQLIB_PATH=<path_to_library> run