Using the System with IIO Oscilloscope
Now its time to start communicating with the EVAL-CN0540-ARDZ, so you can start streaming data. When you first open IIO-Oscilloscope you’ll see two windows.
CN0540 Plugin / DMM / DEBUG Window
IIO Capture Window
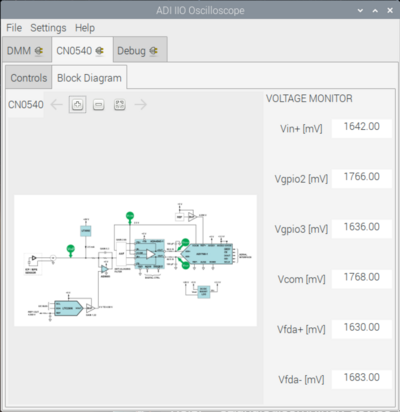
CN0540 IIO-Oscilloscope Plugin
The CN0540 IIO Plugin automatically configures the CN0540, so it is ready to use as soon as you run the application. Calibration of the sensor is also automatically performed so that a user can start using the capture window to collect and analyze data. No other configuration is required for the application.
If you want to re-calibrate the system, shut the system down, or modify individual registers of the devices on the CN0540 that can also be done either using the CN0540 Plugin or using the DEBUG panel to write/read specific registers. This is optional and typically application specific.
Below is a picture of what the CN0540 IIO Plugin looks like.
User interface
Section |
User Control |
Description |
Value |
|---|---|---|---|
Power Control |
SW_FF |
Checks the current status of the ADG5421’s FF Pin |
Low (normal) |
Power Control |
SW_FF |
Checks the current status of the ADG5421’s FF Pin |
High (over voltage) |
Power Control |
Shutdown |
Shutdowns power from the AD7768-1 |
Disabled (Power On) |
Power Control |
Shutdown |
Shutdowns power from the AD7768-1 |
Enabled (Power Down) |
ADC Driver Settings |
FDA Status |
ADA4945 Operational Status |
Checked (Enable) |
ADC Driver Settings |
FDA Status |
ADA4945 Operational Status |
Un-Checked (Disabled) |
ADC Driver Settings |
FDA Mode |
ADA4945 Power Mode |
Checked (Full Power) |
ADC Driver Settings |
FDA Mode |
ADA4945 Power Mode |
Un-Checked (Low Power) |
Sensor Calibrations |
Calibration Result |
The calibration is set for a 10V calibration |
10.0 V |
Sensor Calibrations |
Input Voltage (mV) |
Calibrated AD7768-1 input voltage offset |
~0.0 V |
Sensor Calibrations |
Shift Voltage (mV) |
Calibrated LTC2606 level-shifting voltage |
~0.0 V |
Sensor Calibrations |
Sensor Voltage (mV) |
Calibrated sensor input voltage |
~10.0 V |
Voltage Monitor |
Vin+ (mV) |
Input voltage coming from the sensor |
|
Voltage Monitor |
Vgpoi2 (mV) |
Not Used |
N/A |
Voltage Monitor |
Vgpoi3 (mV) |
Not Used |
N/A |
Voltage Monitor |
Vcom (mV) |
ADA4945 common-mode input voltage |
~2.5 V |
Voltage Monitor |
Vfda+ (mV) |
AD7768‑1 Ain+ input voltage |
IIO Capture Window
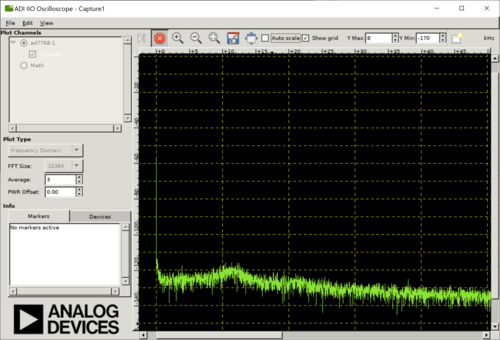
For CbM applications, most customers are typically interested in the frequency domain plots. To obtain a FFT plot, do the following:
Use the drop down menu labeled “Plot Type” and select “Frequency Domain”.
Set the number of samples to 16384.
Set the averaging to 3.
You should see a nice plot like this when connected to the CN0532 sensor.