Characteristics & Performance
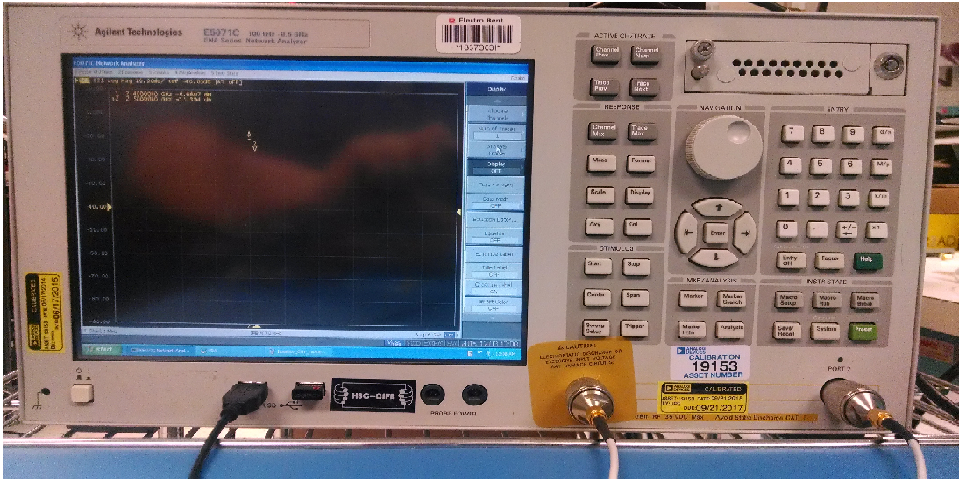
The following equipment was used to generate the characterization data seen below.
Agilent Technologies E5071C ENA Series Network Analyzer (100kHz to 8.5GHz)
Receive Channels Gain vs. Frequency
The following images show the gain vs. frequency response of the receive channels. Each image contains two traces. The first trace shows the gain vs. frequency response when the LNA (HMC669) is enabled. The second trace shows the gain vs. frequency response when the LNA is bypassed.
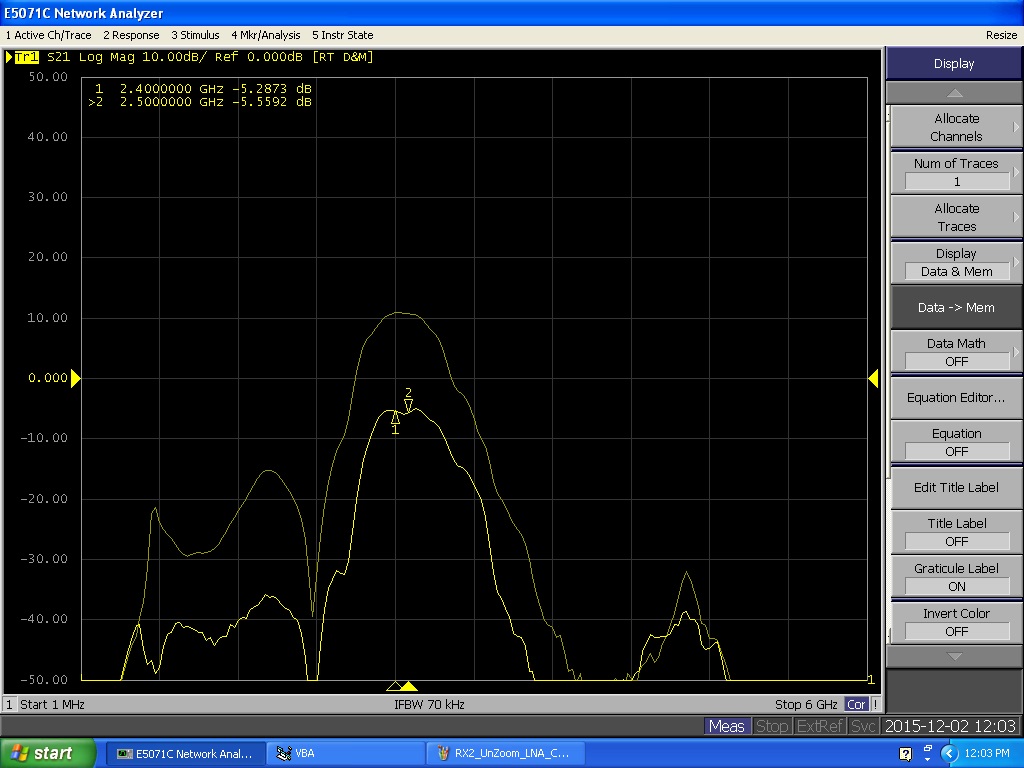
Figure 2 Channel 1 - Gain vs. frequency response - 1MHz to 6GHz.
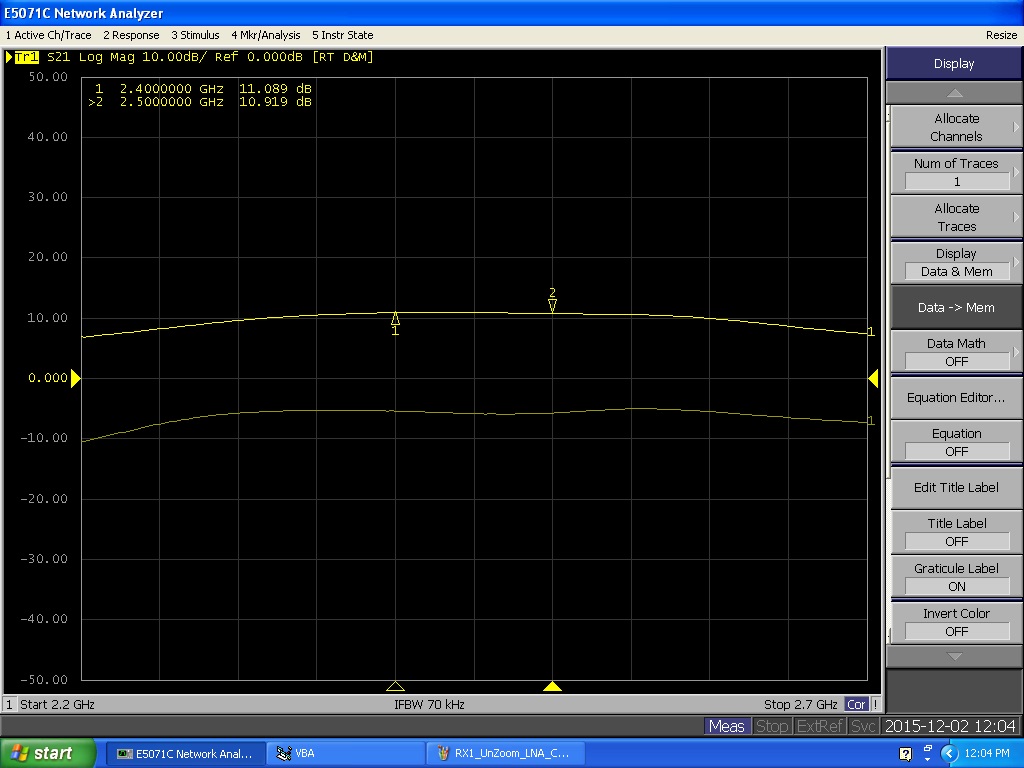
Figure 3 Channel 1 - Gain vs. frequency response - Zoomed in, 2.2GHz to 2.7GHz.
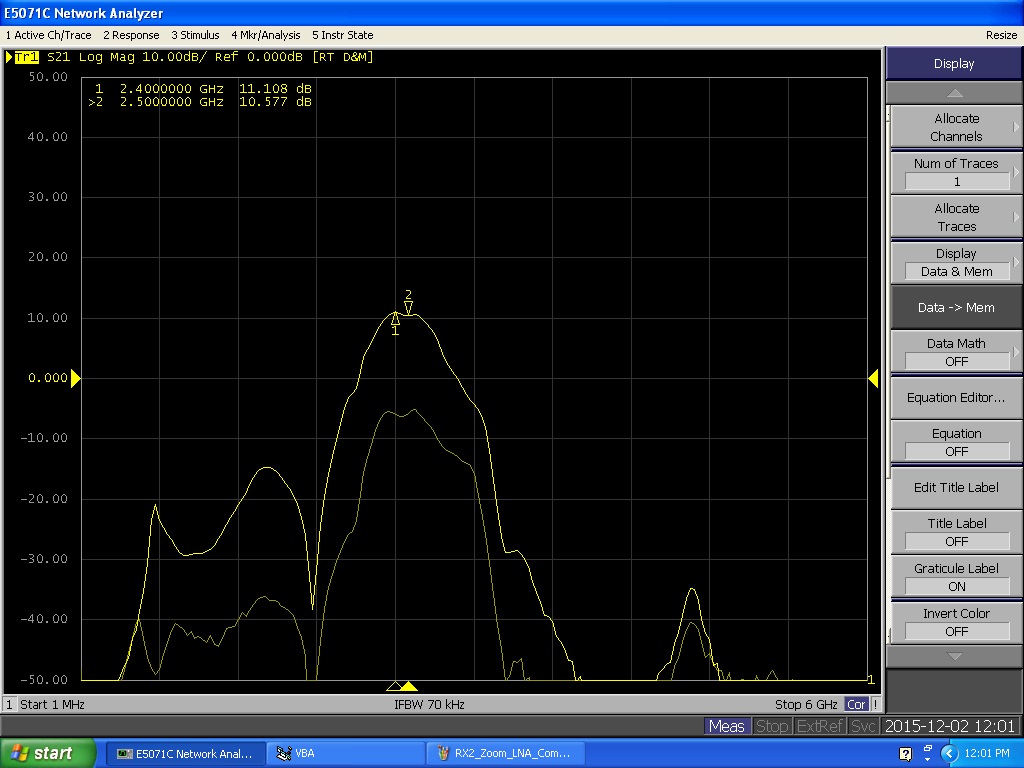
Figure 4 Channel 2 - Gain vs. frequency response - 1MHz to 6GHz.
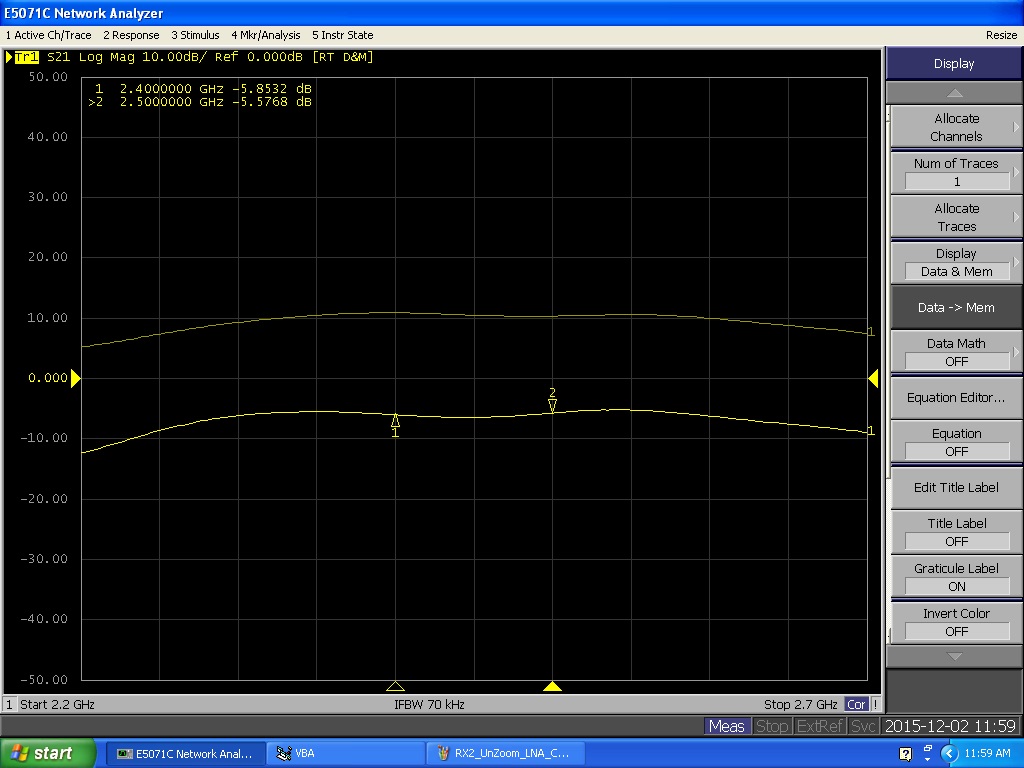
Figure 5 Channel 2 - Gain vs. frequency response - Zoomed in, 2.2GHz to 2.7GHz.
Transmit Channels Gain vs. Frequency
The following images show the gain vs. frequency response of the transmit channels.
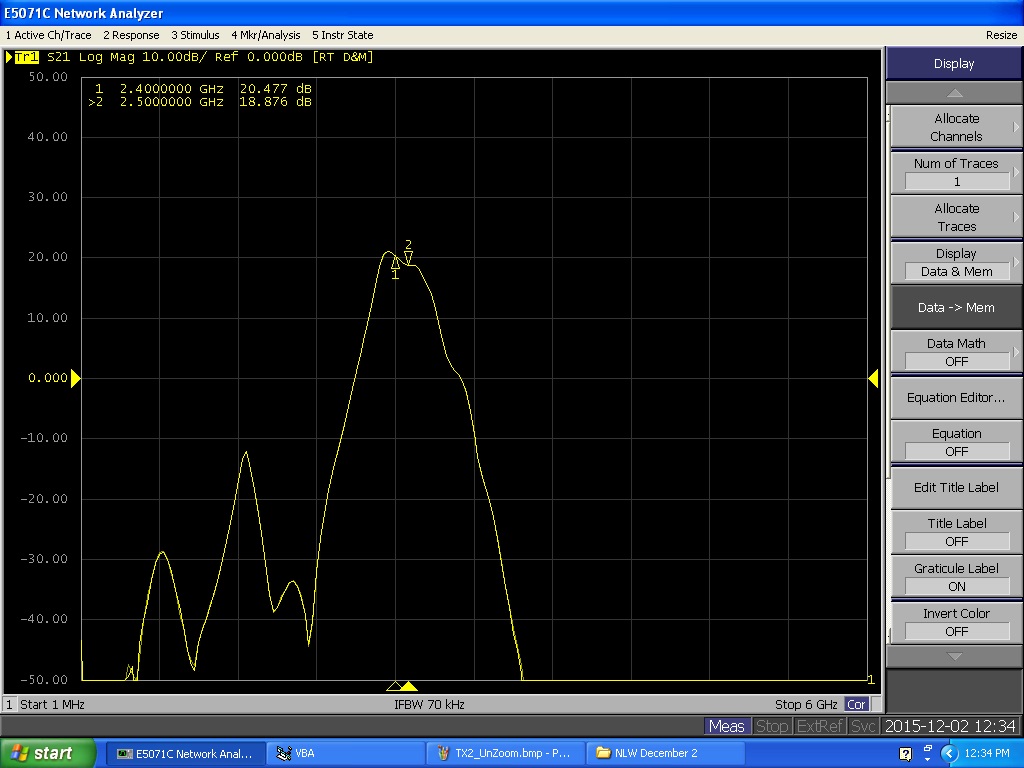
Figure 6 Channel 1 - Gain vs. frequency response - 1MHz to 6GHz.
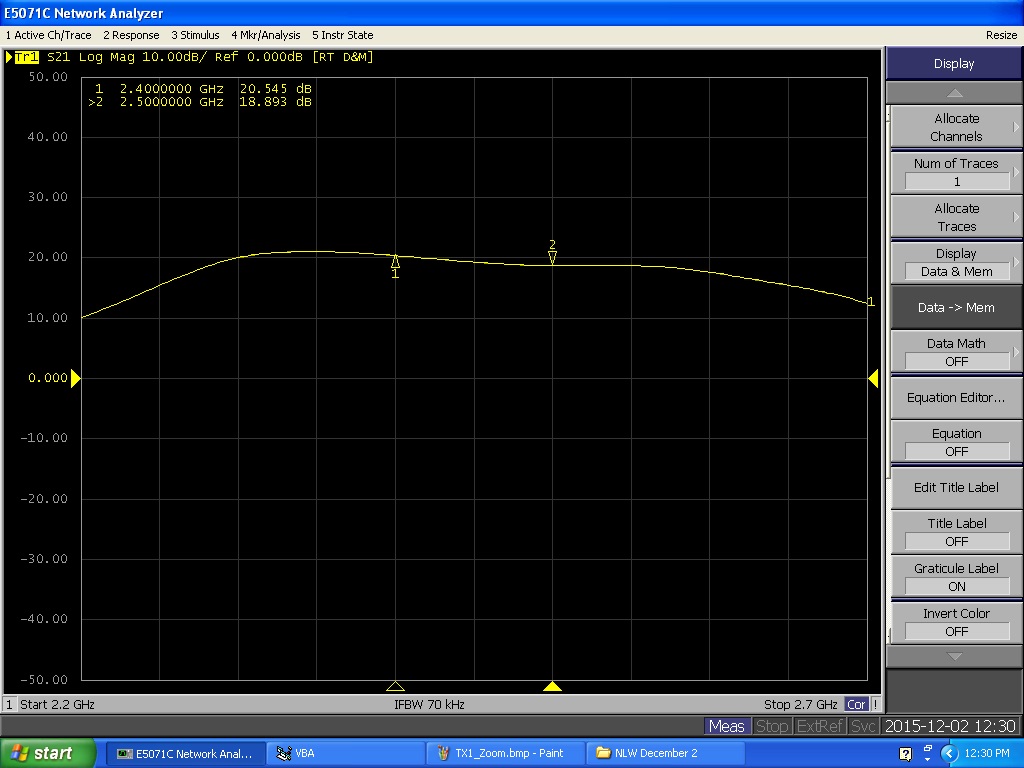
Figure 7 Channel 1 - Gain vs. frequency response - Zoomed in, 2.2GHz to 2.7GHz.
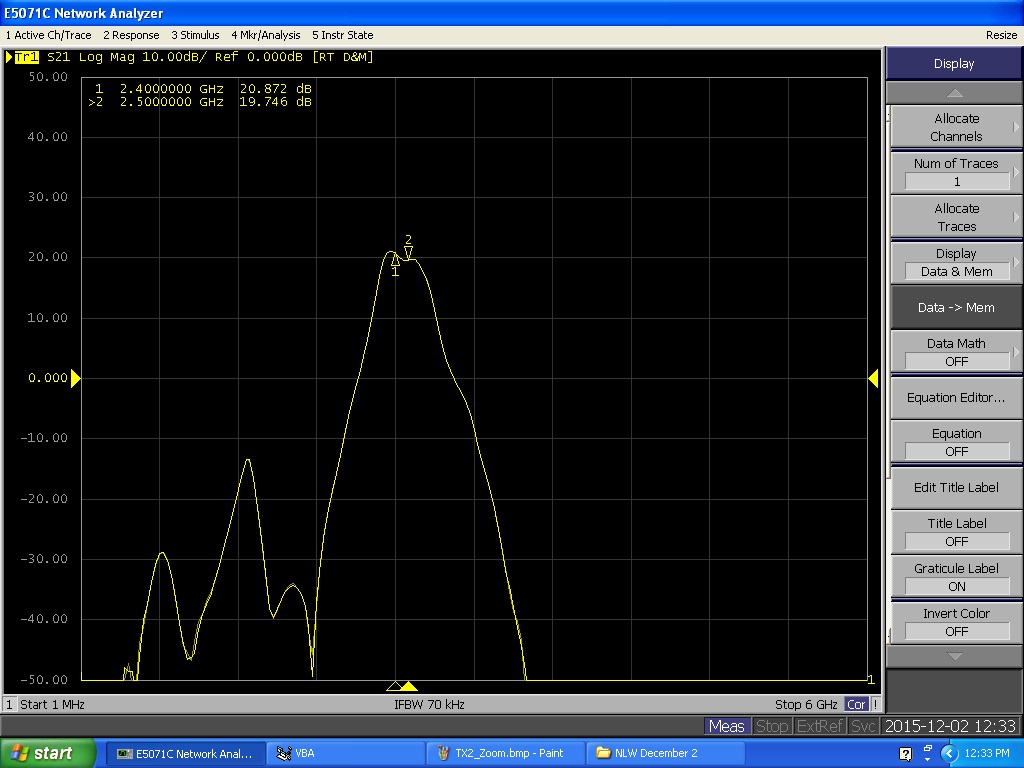
Figure 8 Channel 2 - Gain vs. frequency response - 1MHz to 6GHz.
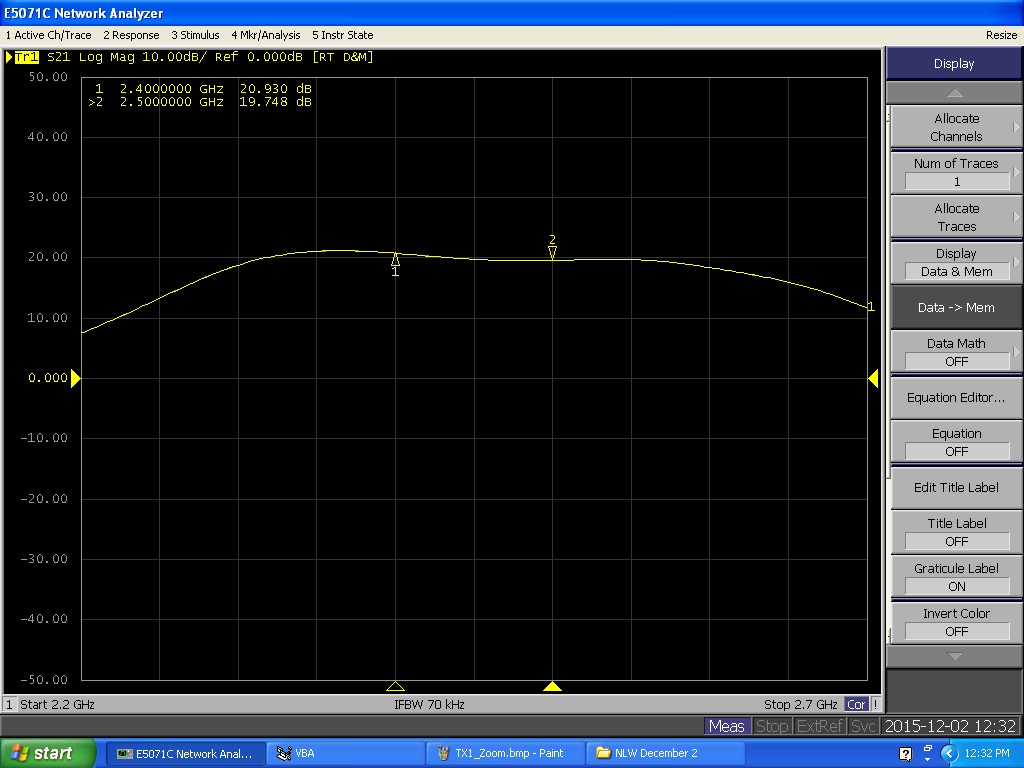
Figure 9 Channel 2 - Gain vs. frequency response - Zoomed in, 2.2GHz to 2.7GHz.
Switch Isolation
The following plots detail results showing the isolation provided by the HMC546LP2 for both channels.
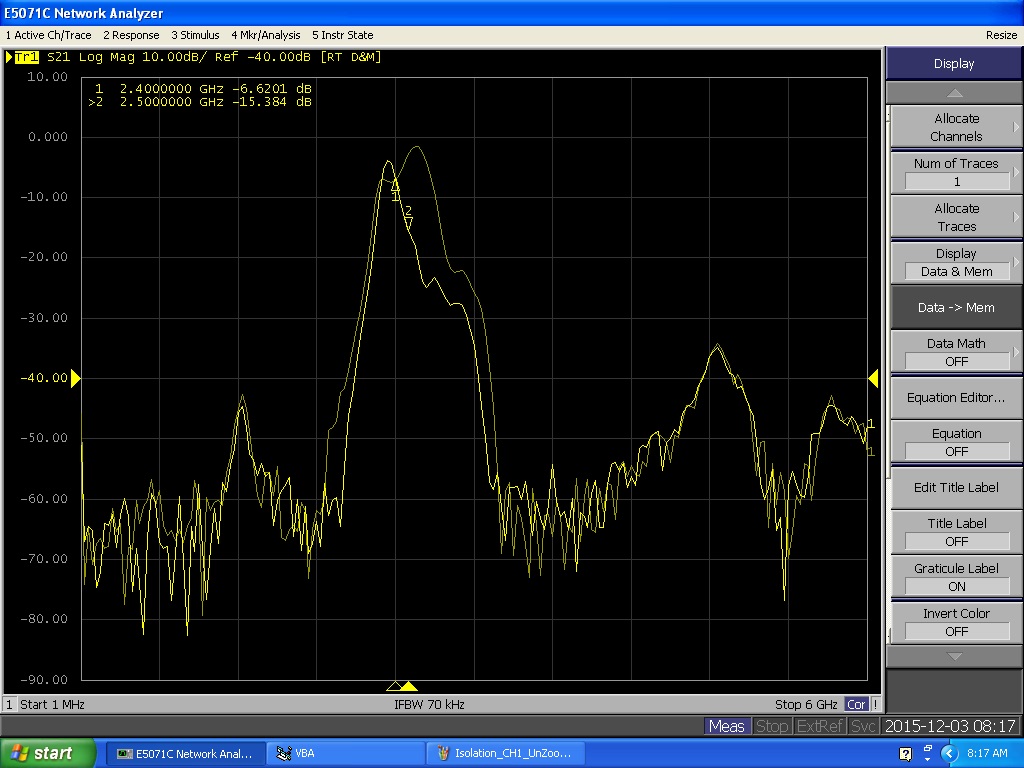
Figure 10 HMC546LP2 Isolation Test, RX Channel 1 - (Signal driving TX1, switch alternating between TX to RFC and RX to RFC, measuring signal on RX1).
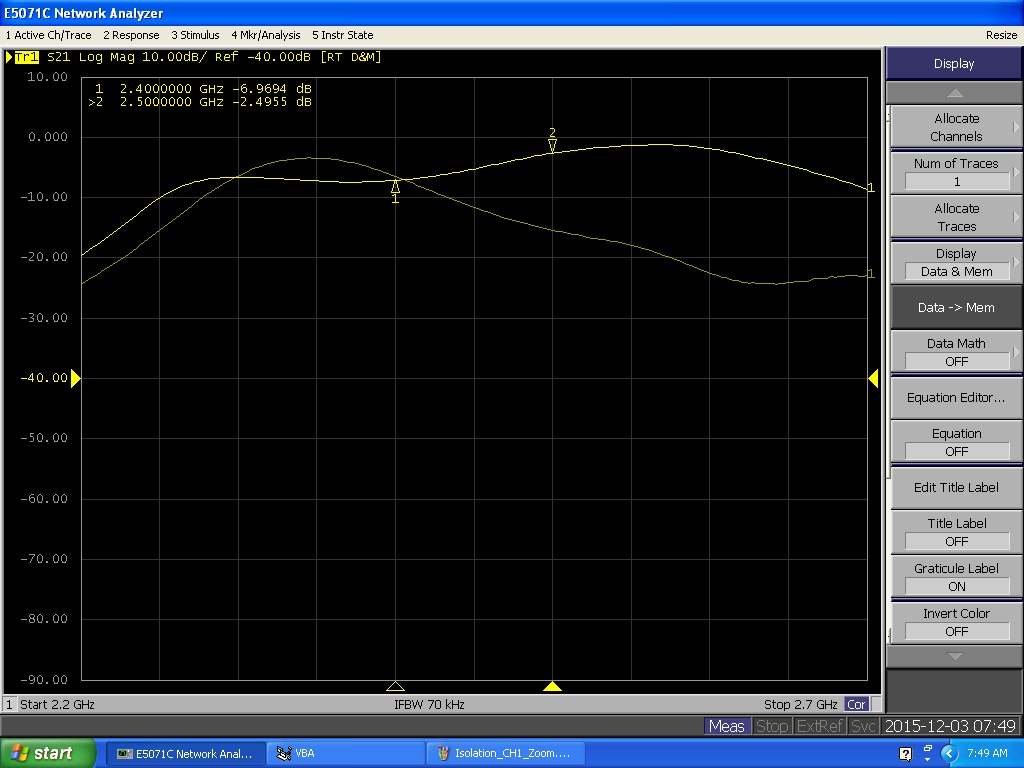
Figure 11 HMC546LP2 Isolation Test, RX Channel 1 - Zoomed in, 2.2GHz to 2.7GHz.
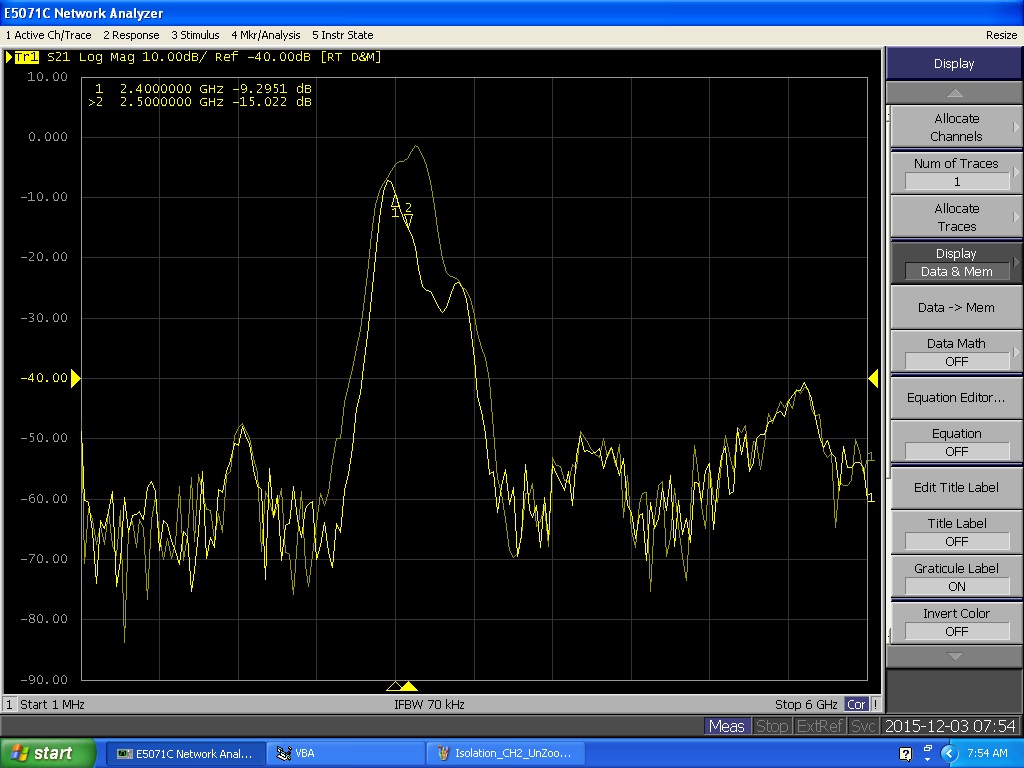
Figure 12 HMC546LP2 Isolation Test, RX Channel 2 - (Signal driving TX2, switch alternating between TX to RFC and RX to RFC, measuring signal on RX2).
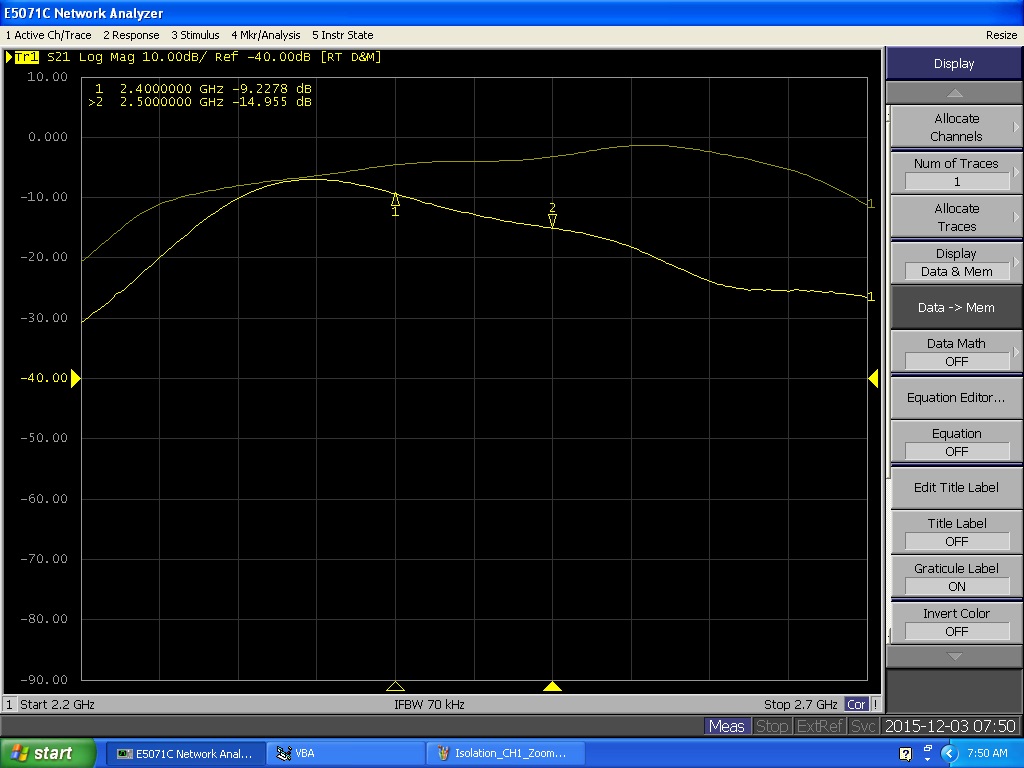
Figure 13 HMC546LP2 Isolation Test, RX Channel 2 - Zoomed in, 2.2GHz to 2.7GHz.