Transmitter front end overview & theory of operation
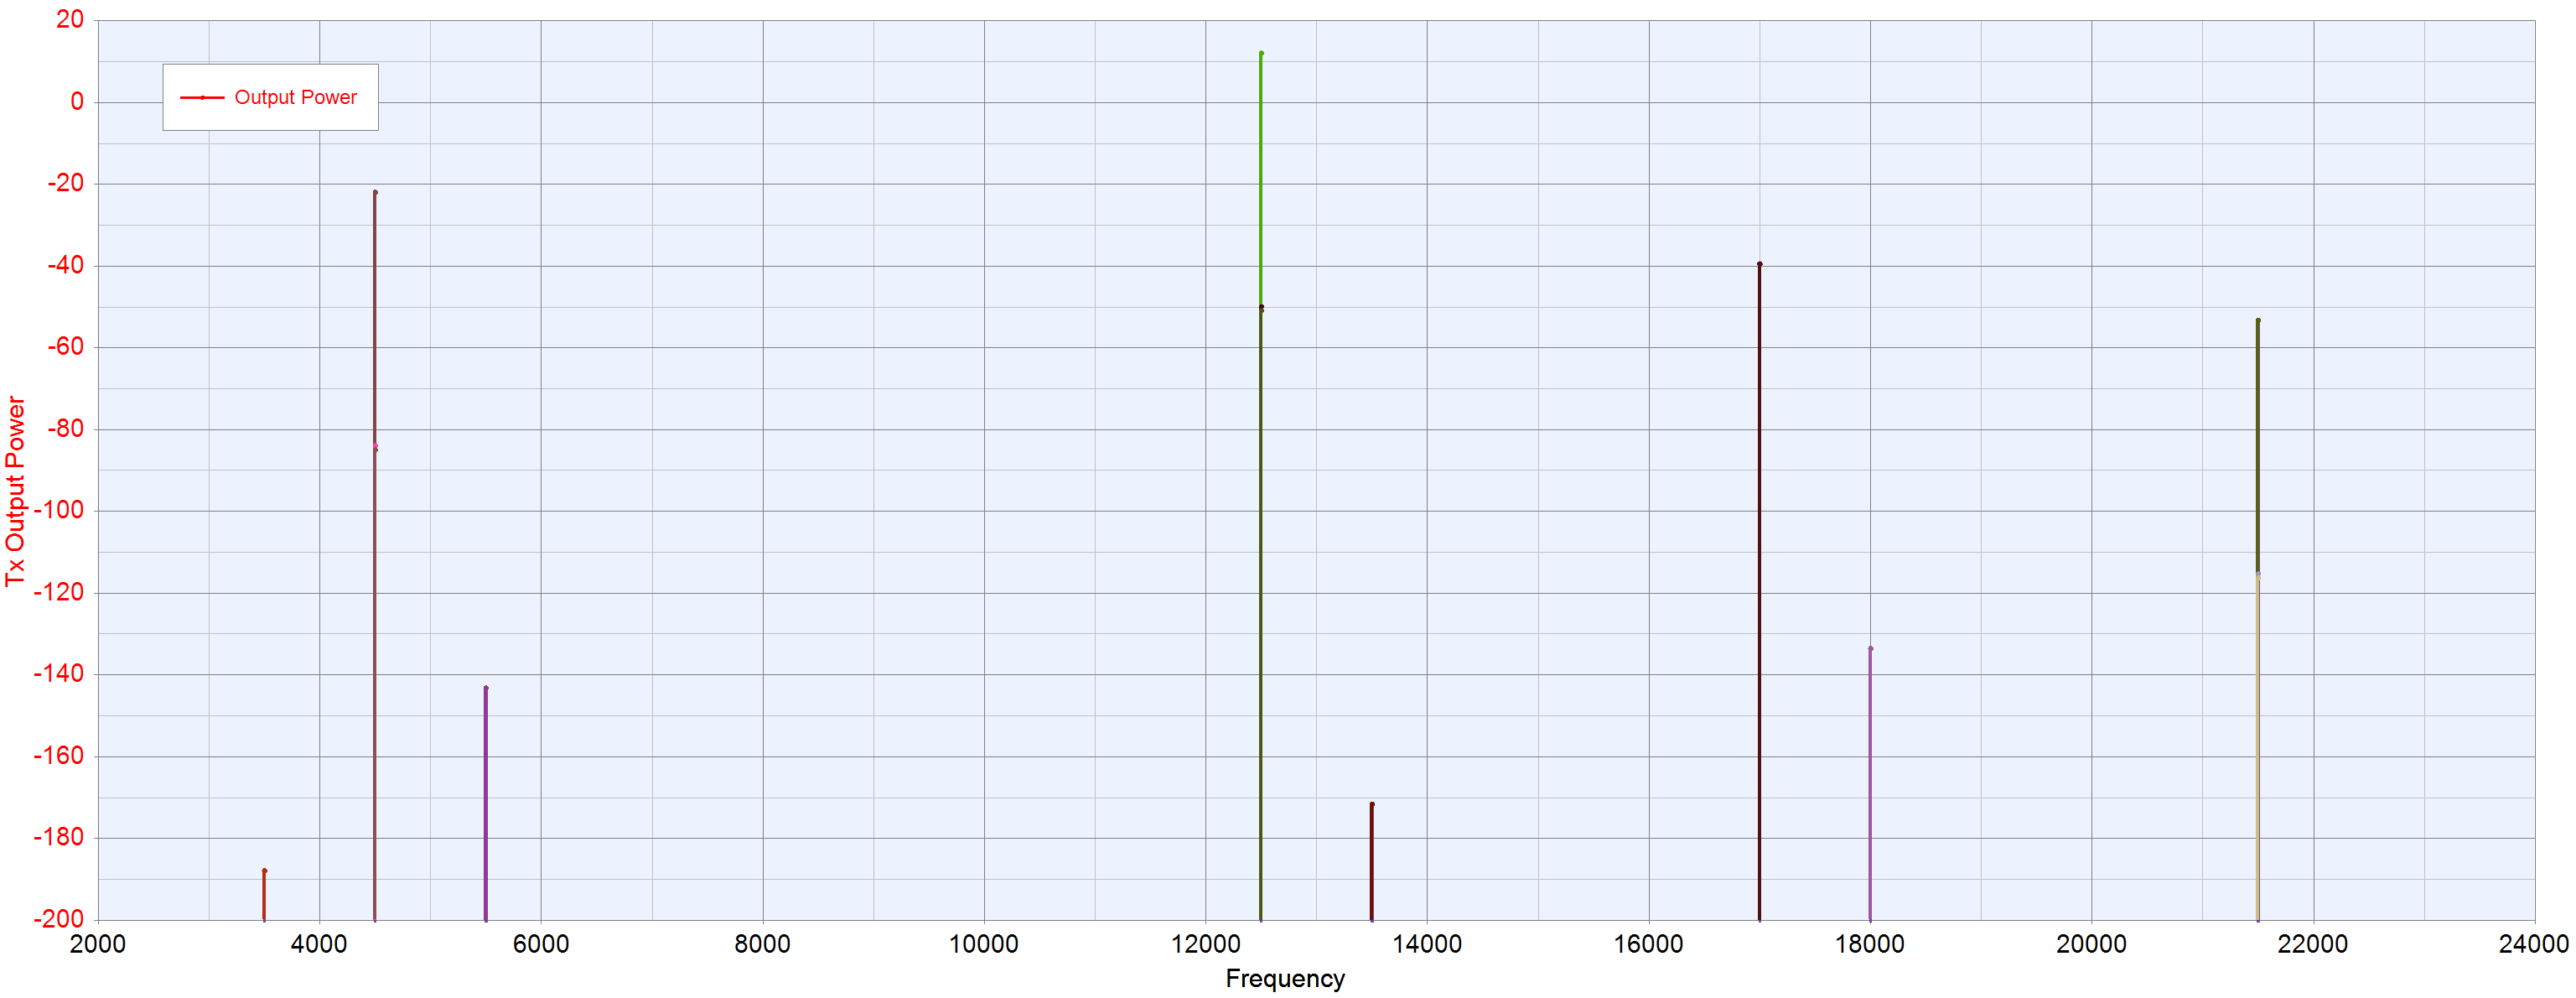
The 2-24 GHz transmitter block diagram is shown below. The following sections go into more detail on the theory of operation of the individual, functional blocks of the signal chain.
IF input stage
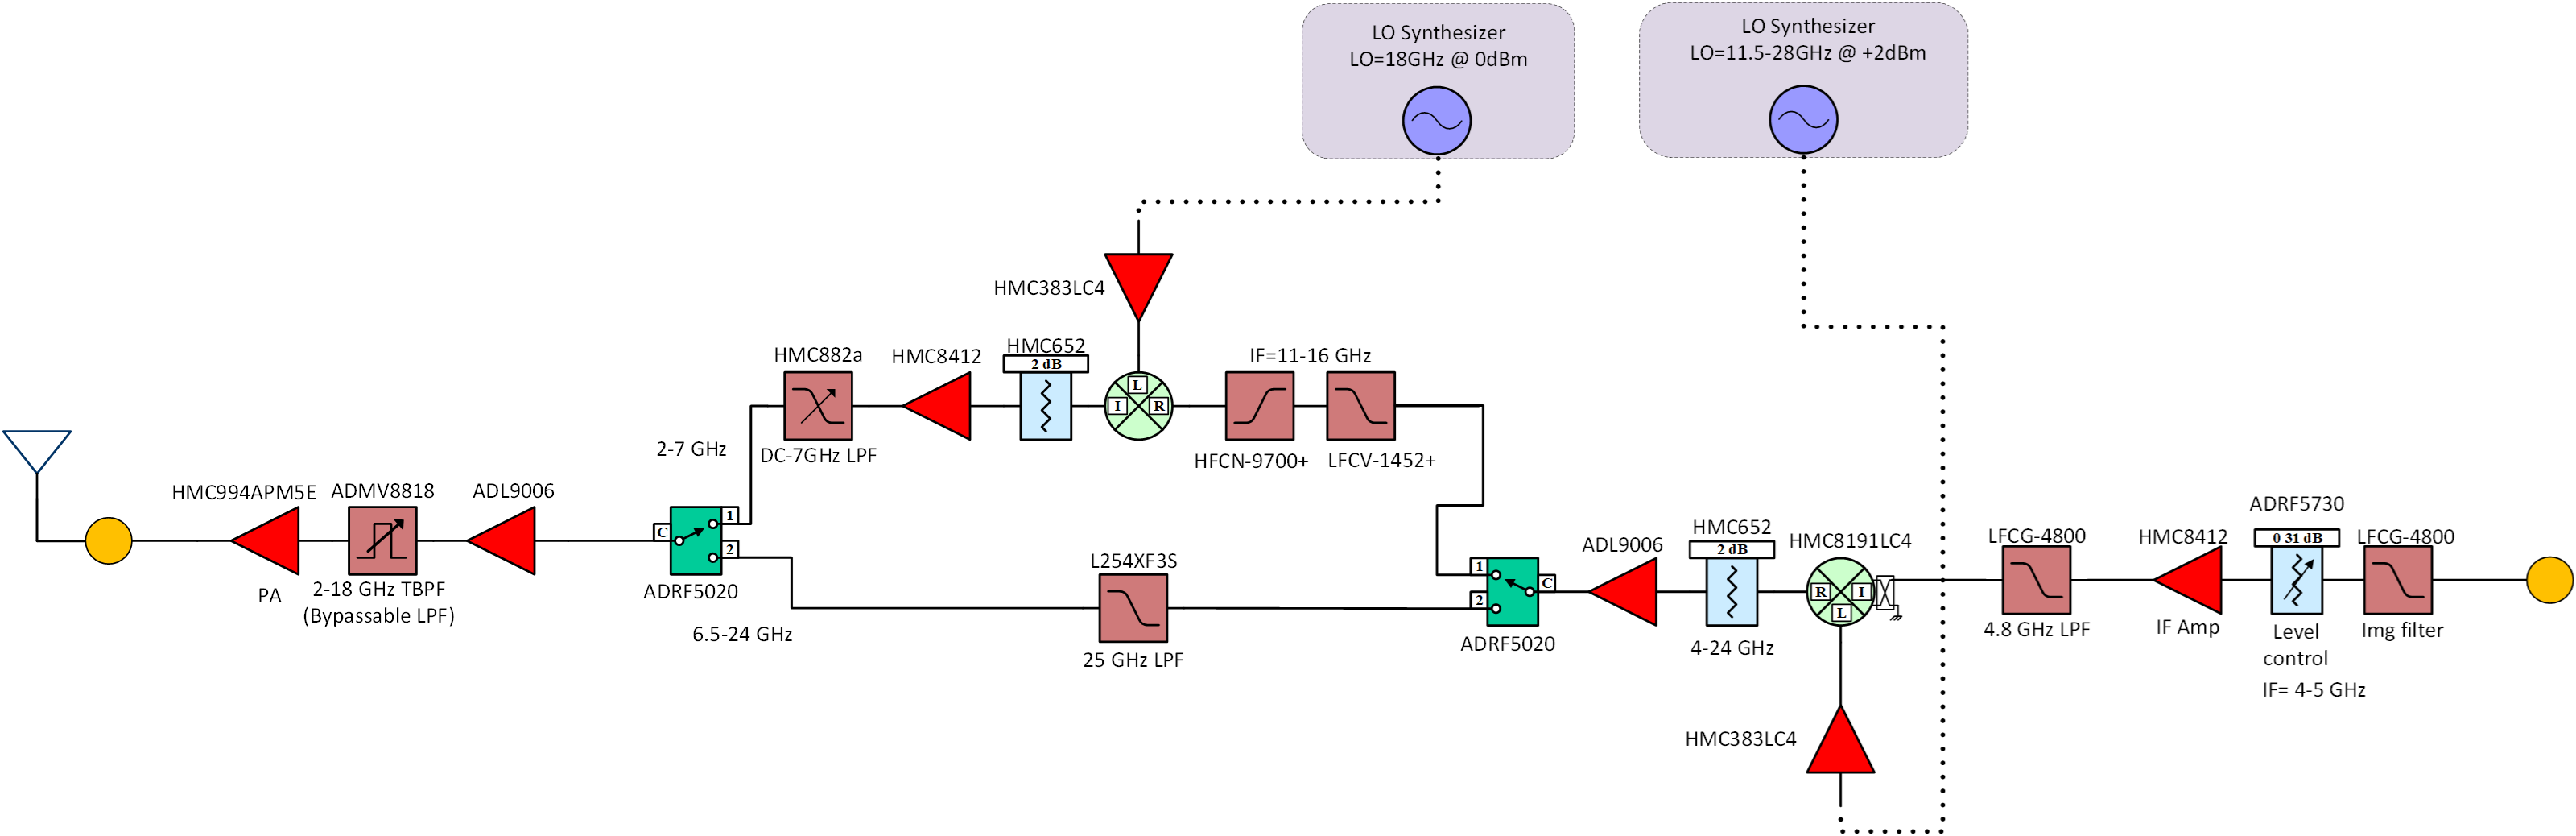
The DAC output first feeds into the IF input section (block diagram below) of the front end with 4.8 GHz low-pass filtering to reject the DAC image spurious. The IF input frequency is 4-5 GHz and within the 1st Nyquist of the DAC sampling at 12 GSPS. After the image LPF comes an ADRF5730 digital step attenuator for fine resolution level control, an LNA, and an additional LPF for additional suppression of DAC output spurious.
Frequency conversion stage & frequency plan
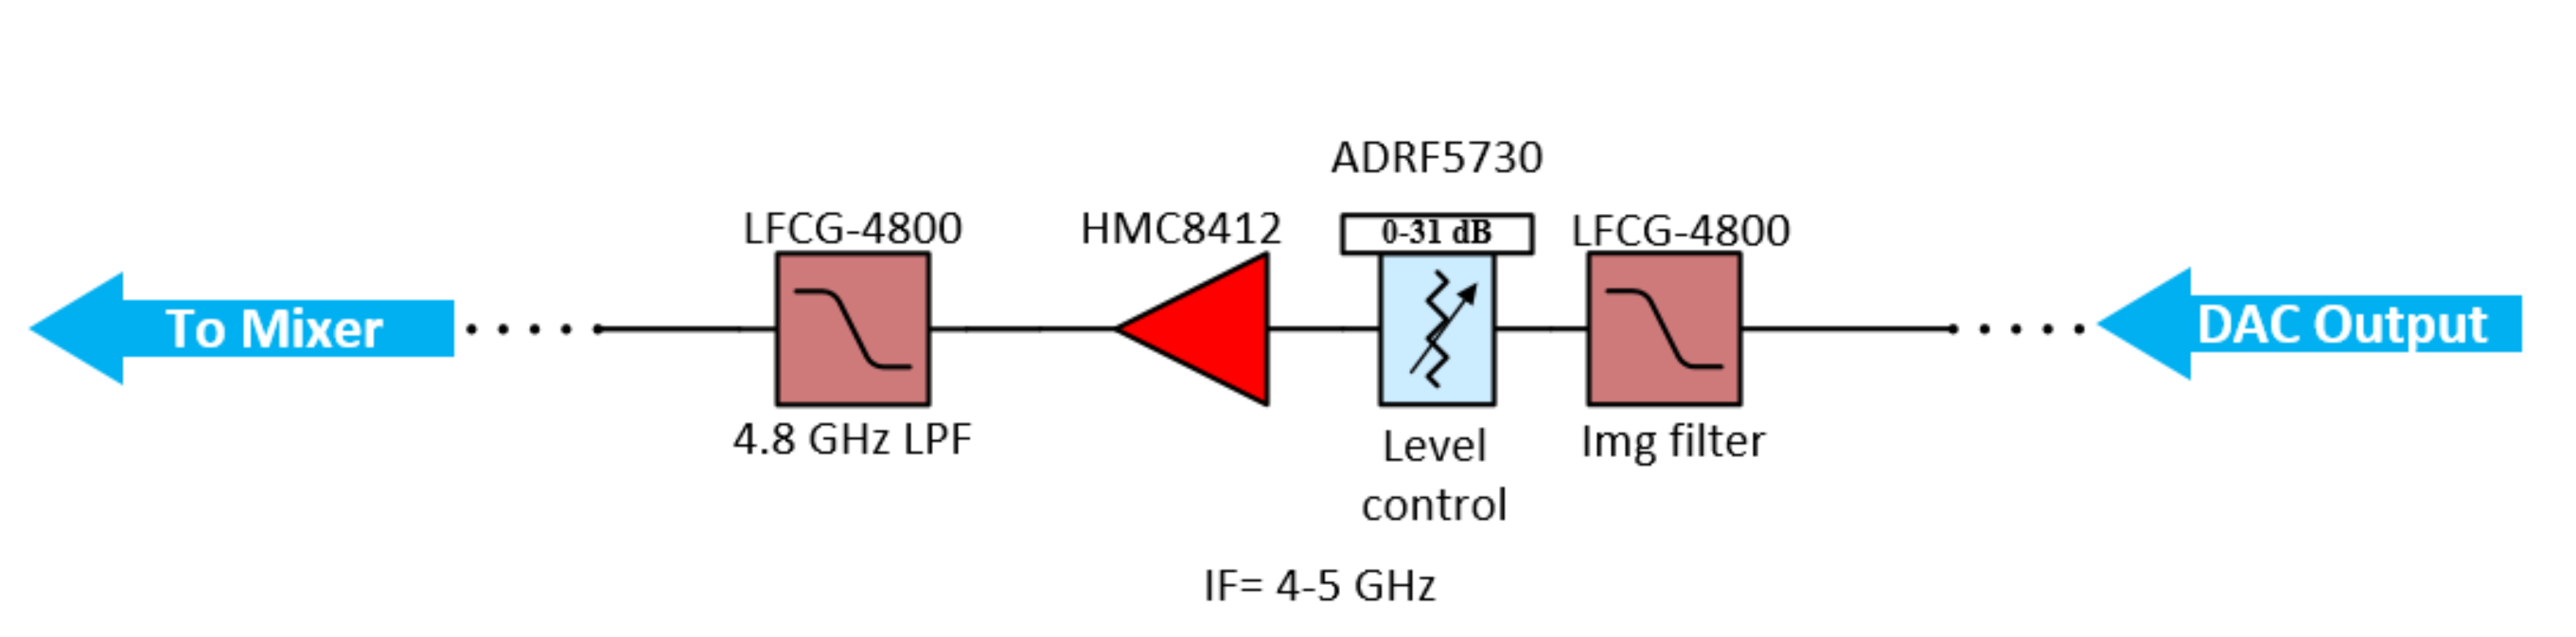
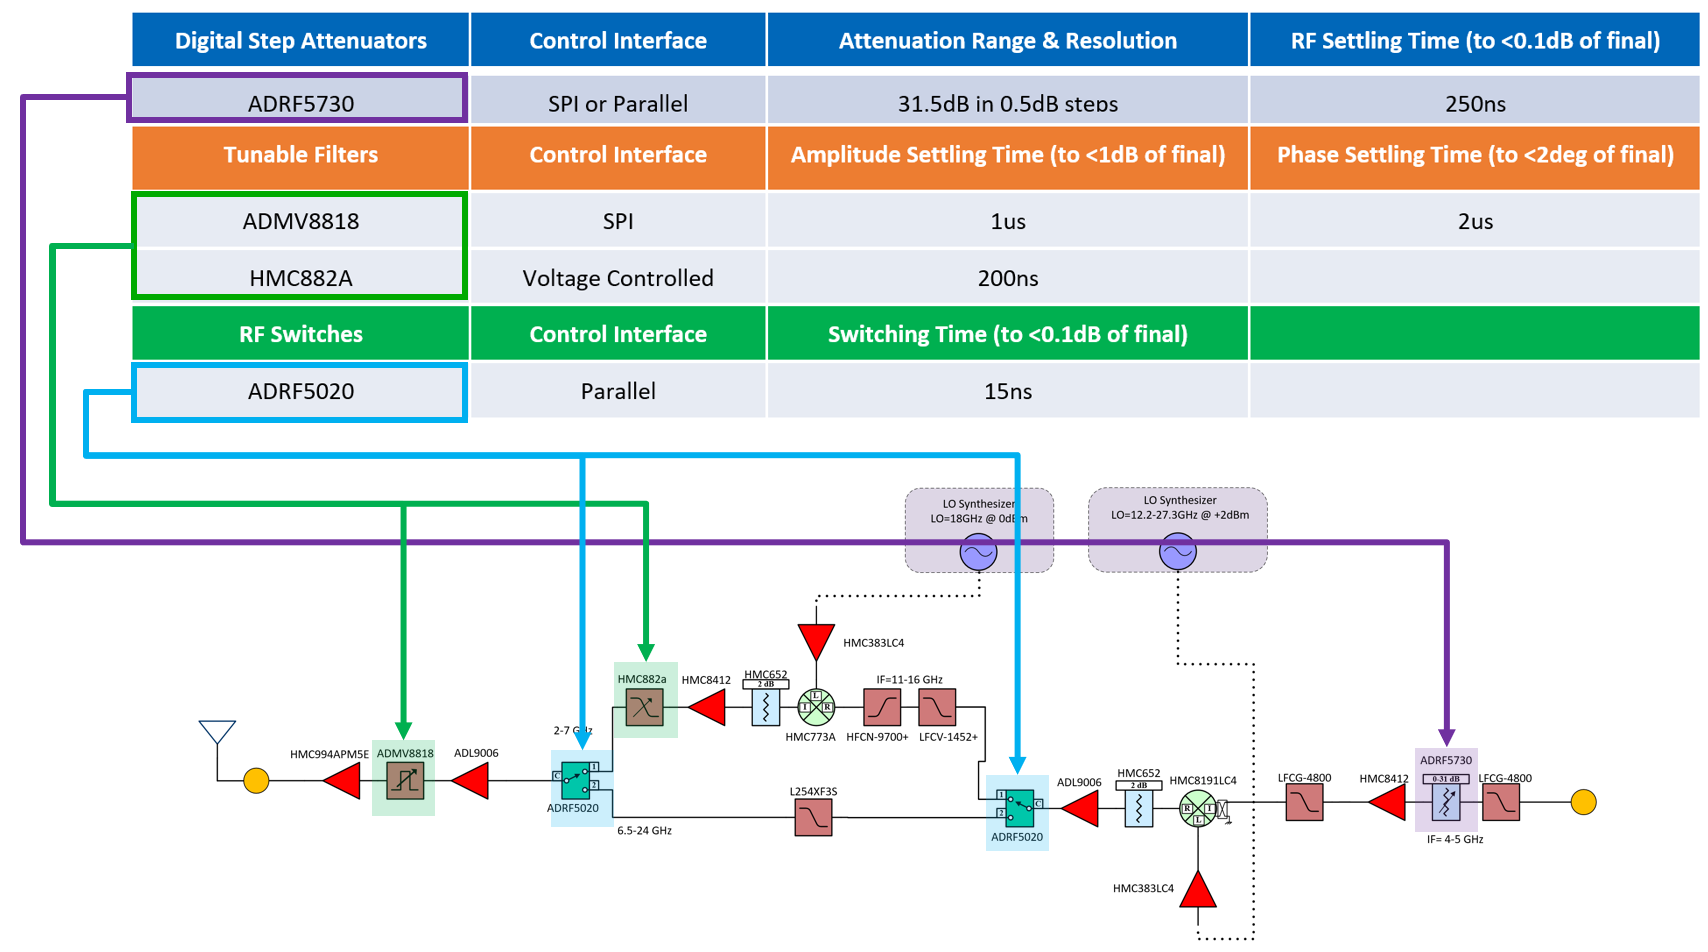
The transmit signal chain uses two separate frequency conversion paths to enable continuous, 2-24 GHz frequency coverage. The two signal paths are selectable via ADRF5020 RF switches. For the 6.5-24 GHz RF output frequency band, the 4-5 GHz IF input is fed into an HMC8191 wideband I/Q mixer with a tunable LO source, upconverting the entire band to the desired RF output frequency.
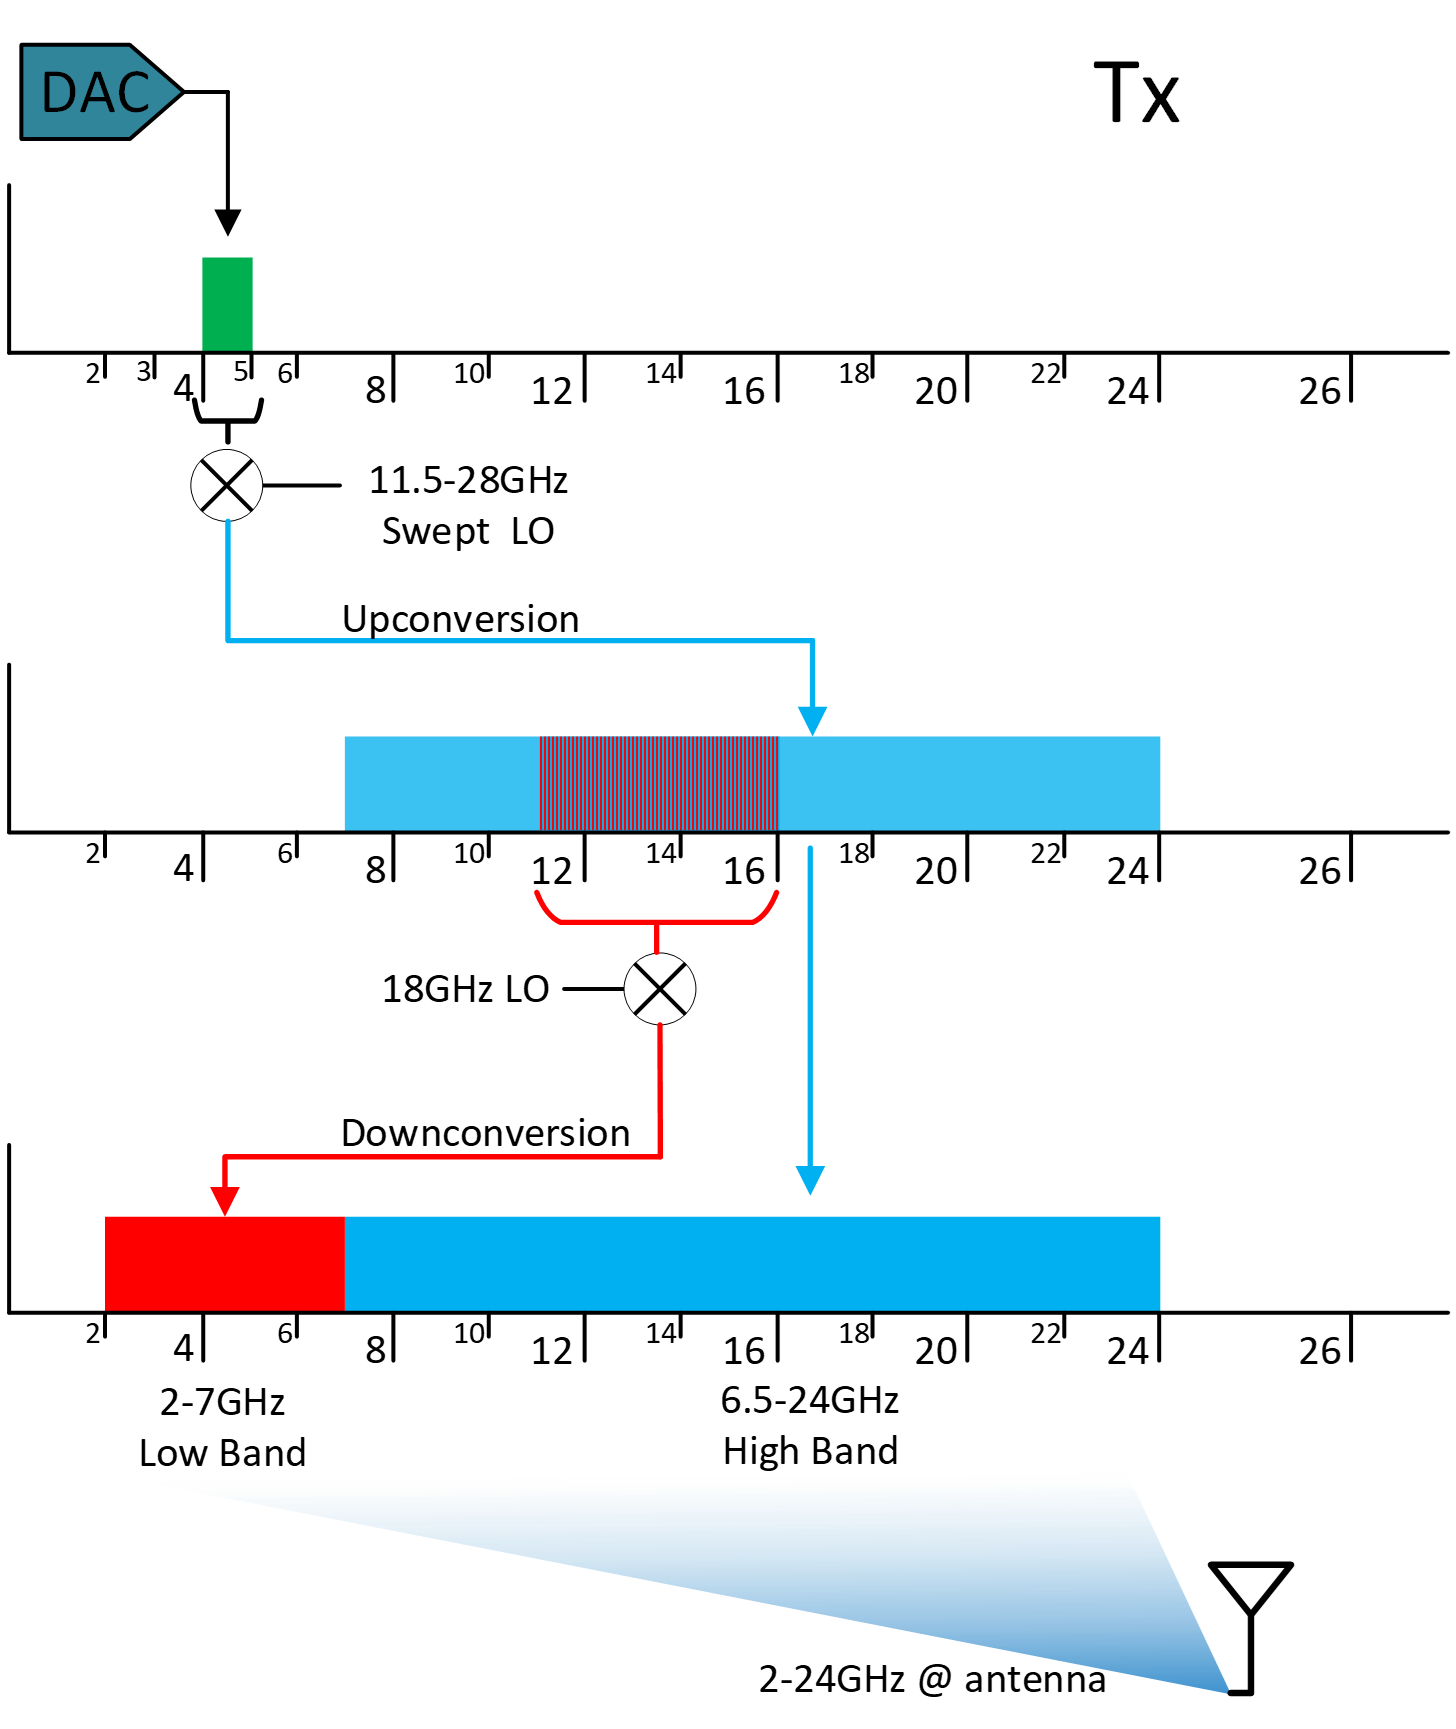
For the 2-7 GHz RF output band, a dual-frequency conversion heterodyne signal path is used with the IF input first being upconverted to a high, 11-16 GHz IF through the HMC8191 with tunable LO, and then downconverted to the 2-7 GHz RF output through an HMC773A mixer with a fixed 18 GHz LO. Cascaded low and high-pass filters provide 11-16 GHz IF filtering and an HMC882A tunable low pass filter mitigates mixer output spurious for the final 2-7 GHz RF output band. The figure below shows the frequency conversion section of the signal chain and the frequency operation ranges for each individual path.
The figure below provides an additional frequency plan visualization showing the individual frequency conversion steps for each frequency band.
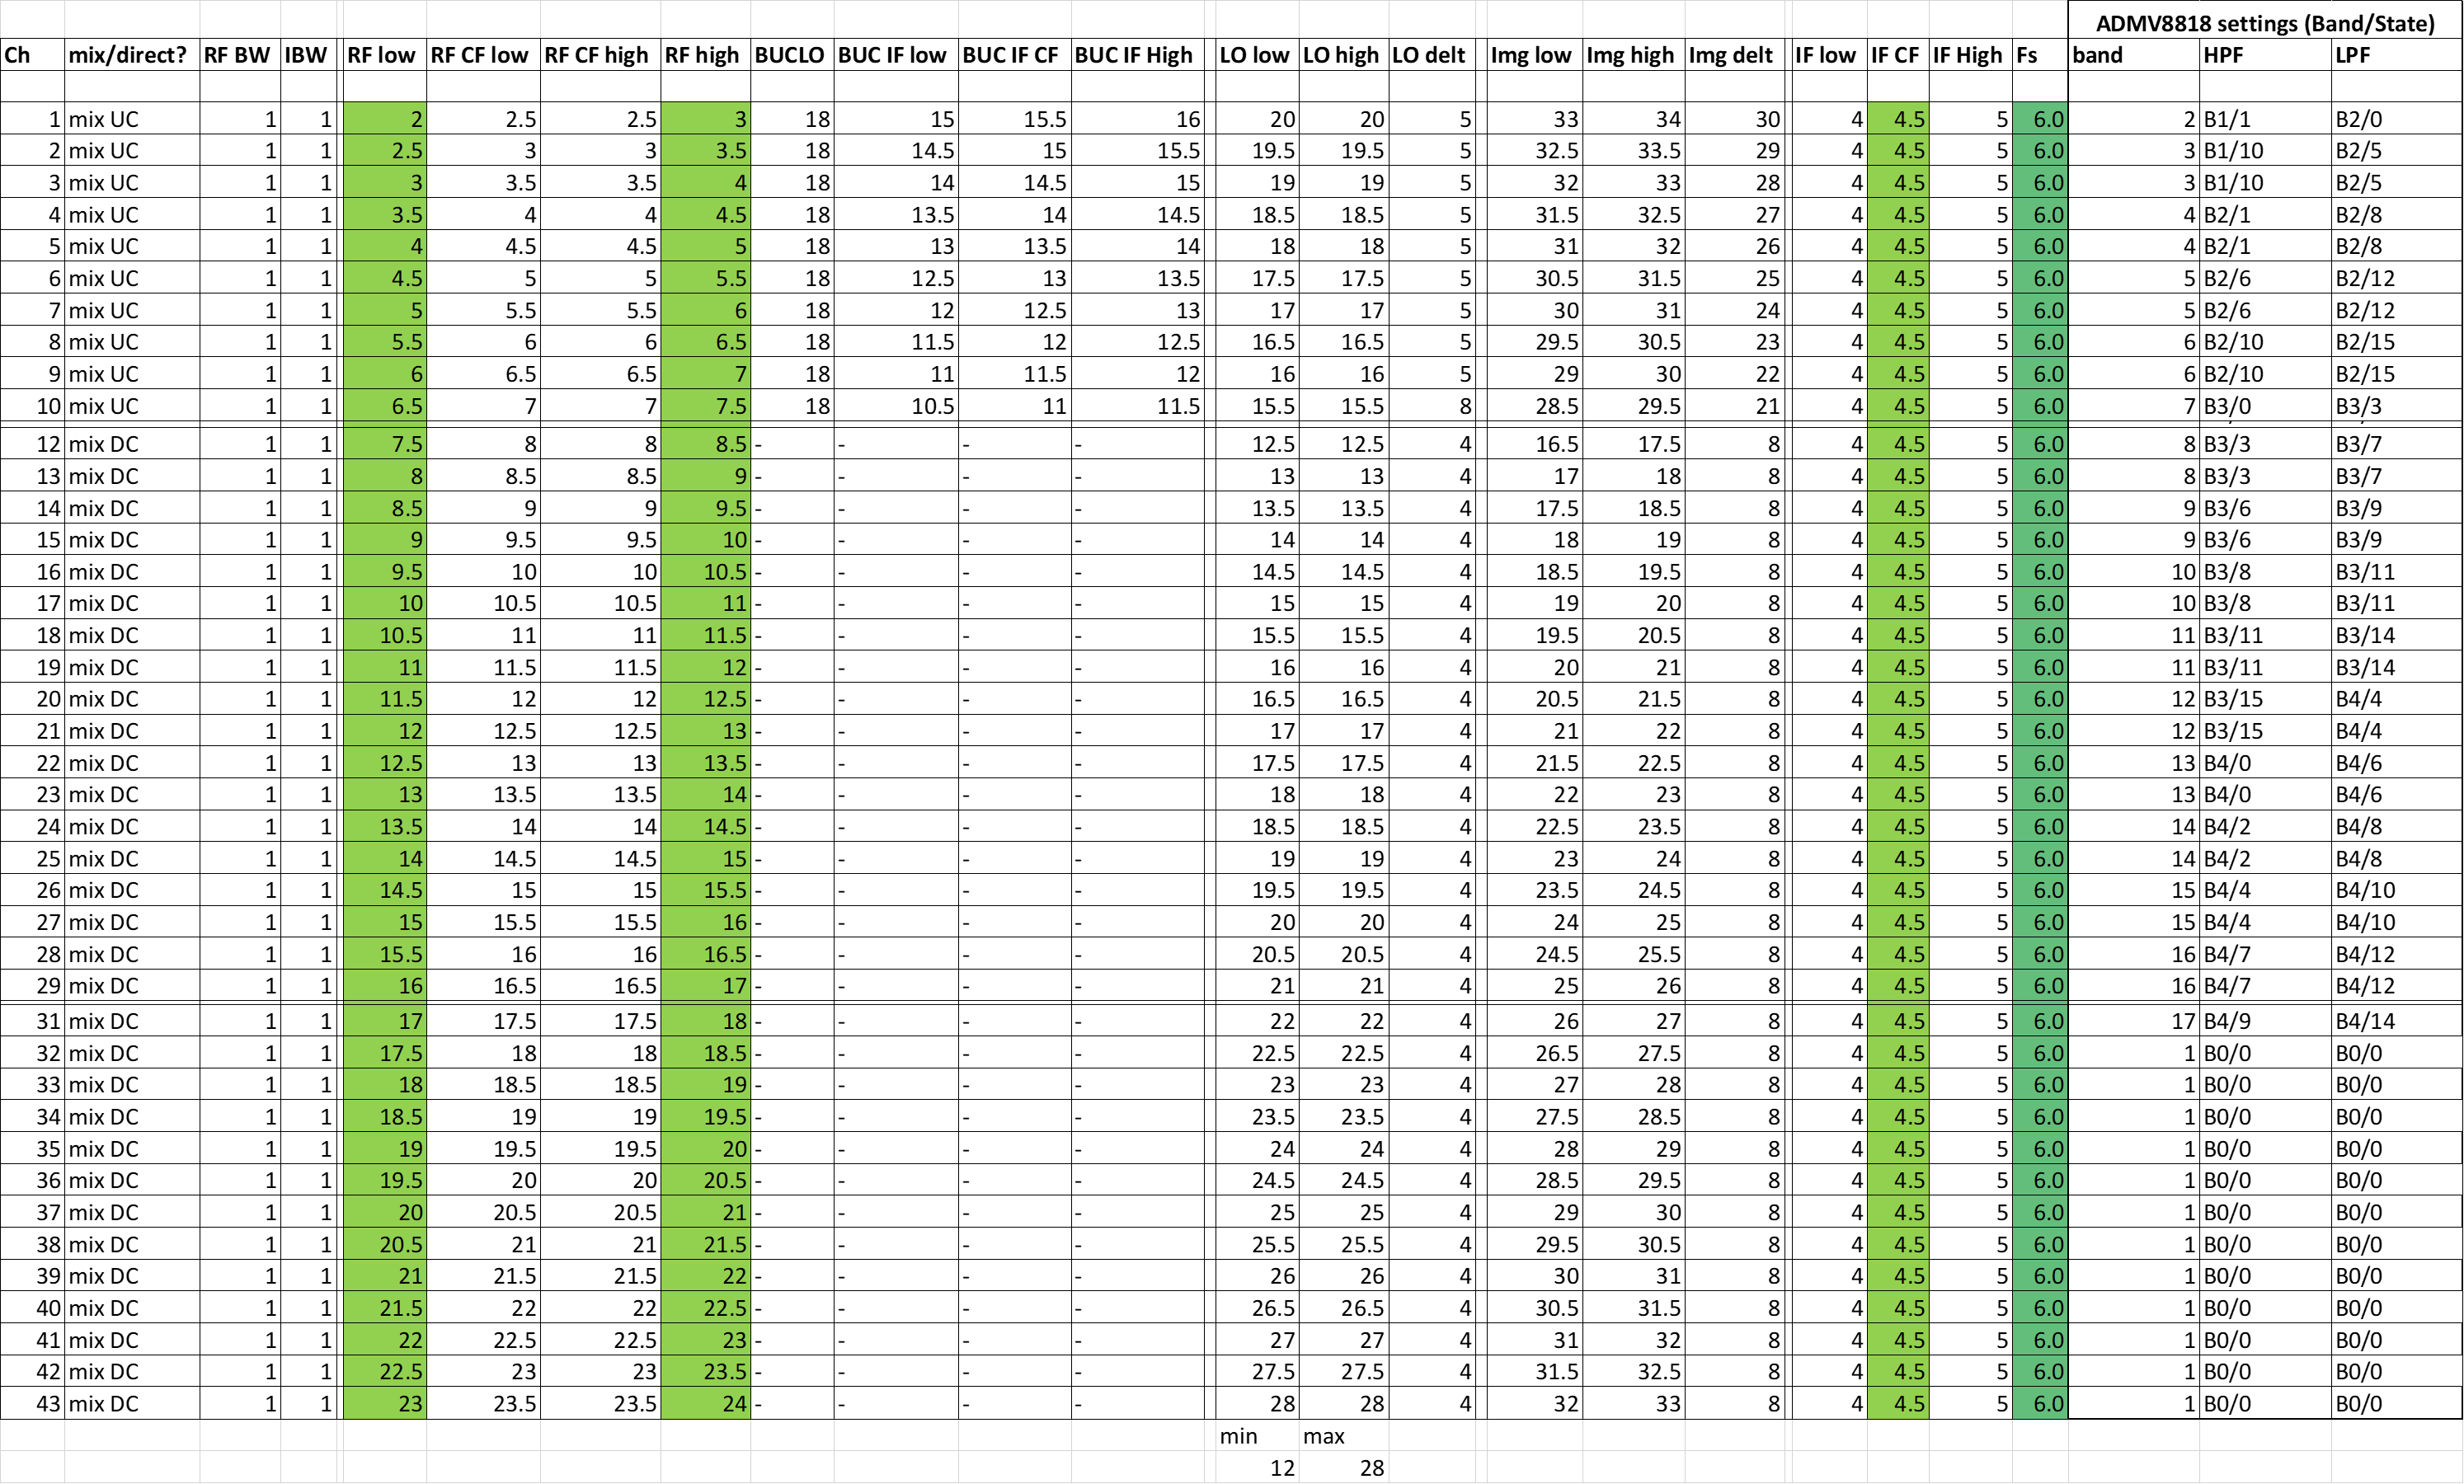
The following table summarizes the possible frequency conversion paths:
RF output stage
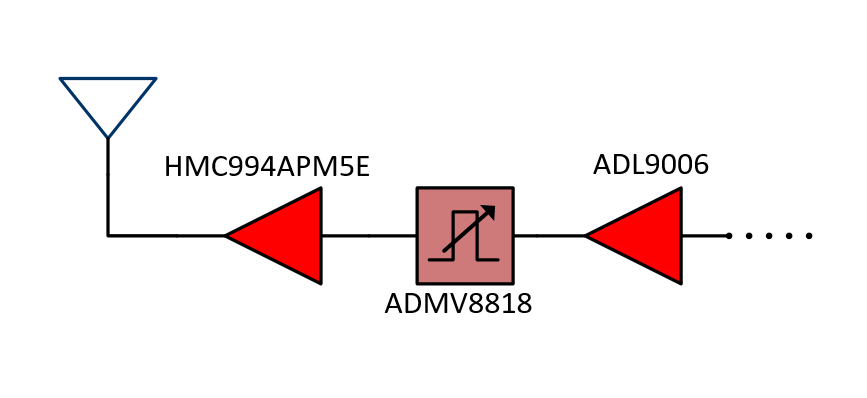
The RF output stage, shown in the figure below, is comprised of a wideband ADL9006 driver amp, an ADMV8818 tunable bandpass filter, and finally an HMC994APM5E PA. The ADMV8818 tunable filter operates across a 2-18 GHz frequency range for additional filtering of output spurious, and can be bypassed for operation up to 24 GHz.
Timing & control
Transmitter performance simulations
Keysight SystemVue/Genesys was used for detailed signal chain modelling and cascade analysis. Every component in the signal chain was modelled with frequency-dependent sys-parameter or s-parameter datasets to ensure accurate simulation results. The Genesys signal chain model shown below takes into account the following components:
Manufacturer-provided, frequency-dependent s-parameter or sys-parameter datasets for every active and passive RF component
A standalone model of the ADMV8818 tunable bandpass filter configured to tune a 1 GHz wide passband to the RF center frequency during frequency sweeps. The ADMV8818 internal bypass path is engaged above 18 GHz.
A standalone model of the HMC882A tunable lowpass filter configured to tune its 3 dB corner frequency to minimize LO feedthrough and spurious
Frequency-dependent component interconnect modelling i.e. PCB trace loss approximation for DC-50 GHz CPWG traces, 8 mil Rogers 4003 PCB stackup

The complete Keysight Genesys/SystemVue simulation workspaces for the Rx and Tx signal chains are available on request, see Requesting design files.
The Genesys workspace already has numerous system analysis and MATLAB-based frequency sweeps in place, including the following functionality:
2-24 GHz CW input sweep with MATLAB equation-based frequency plan automated to ensure correct signal chain configuration for any given RF output frequency. All LO frequencies, frequency-dependent RF paths, and tunable filter passbands automatically tune during sweep.
Gain levelling implemented using the IF DSAs to normalize cascaded gain to the lowest-gain frequency point for optimal flatness (+/- 2 dB).
Transmitter performance
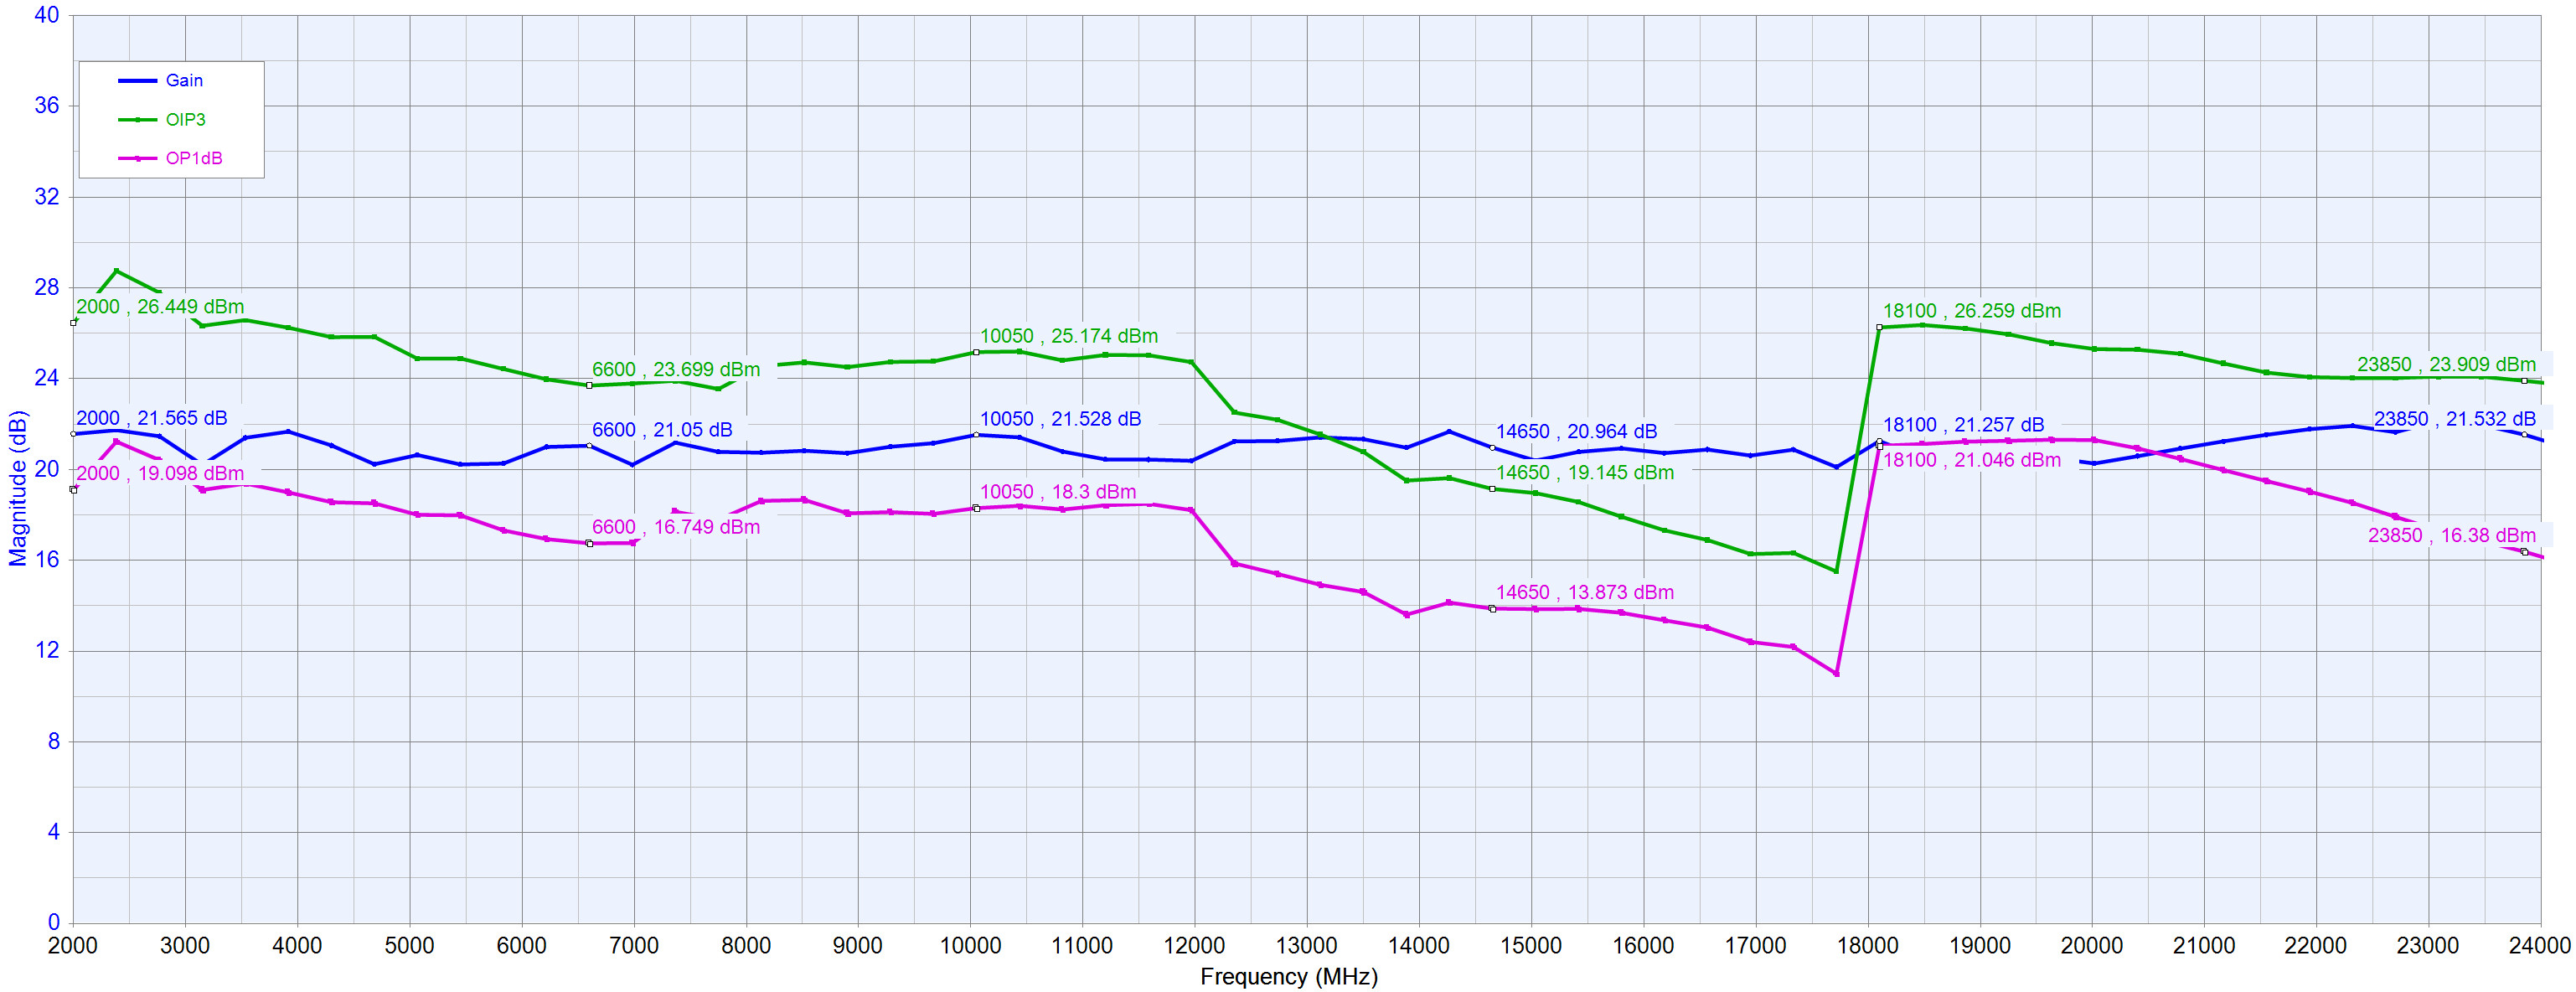
Gain, OIP3, and OP1dB, 2-24 GHz, rough gain levelling implemented.
As described above, the following plot assumes PCB implementation with low loss traces. This plot shows the Gain, OIP3, and OP1dB performance of the transmitter across frequency:
Transmitter output spectrum
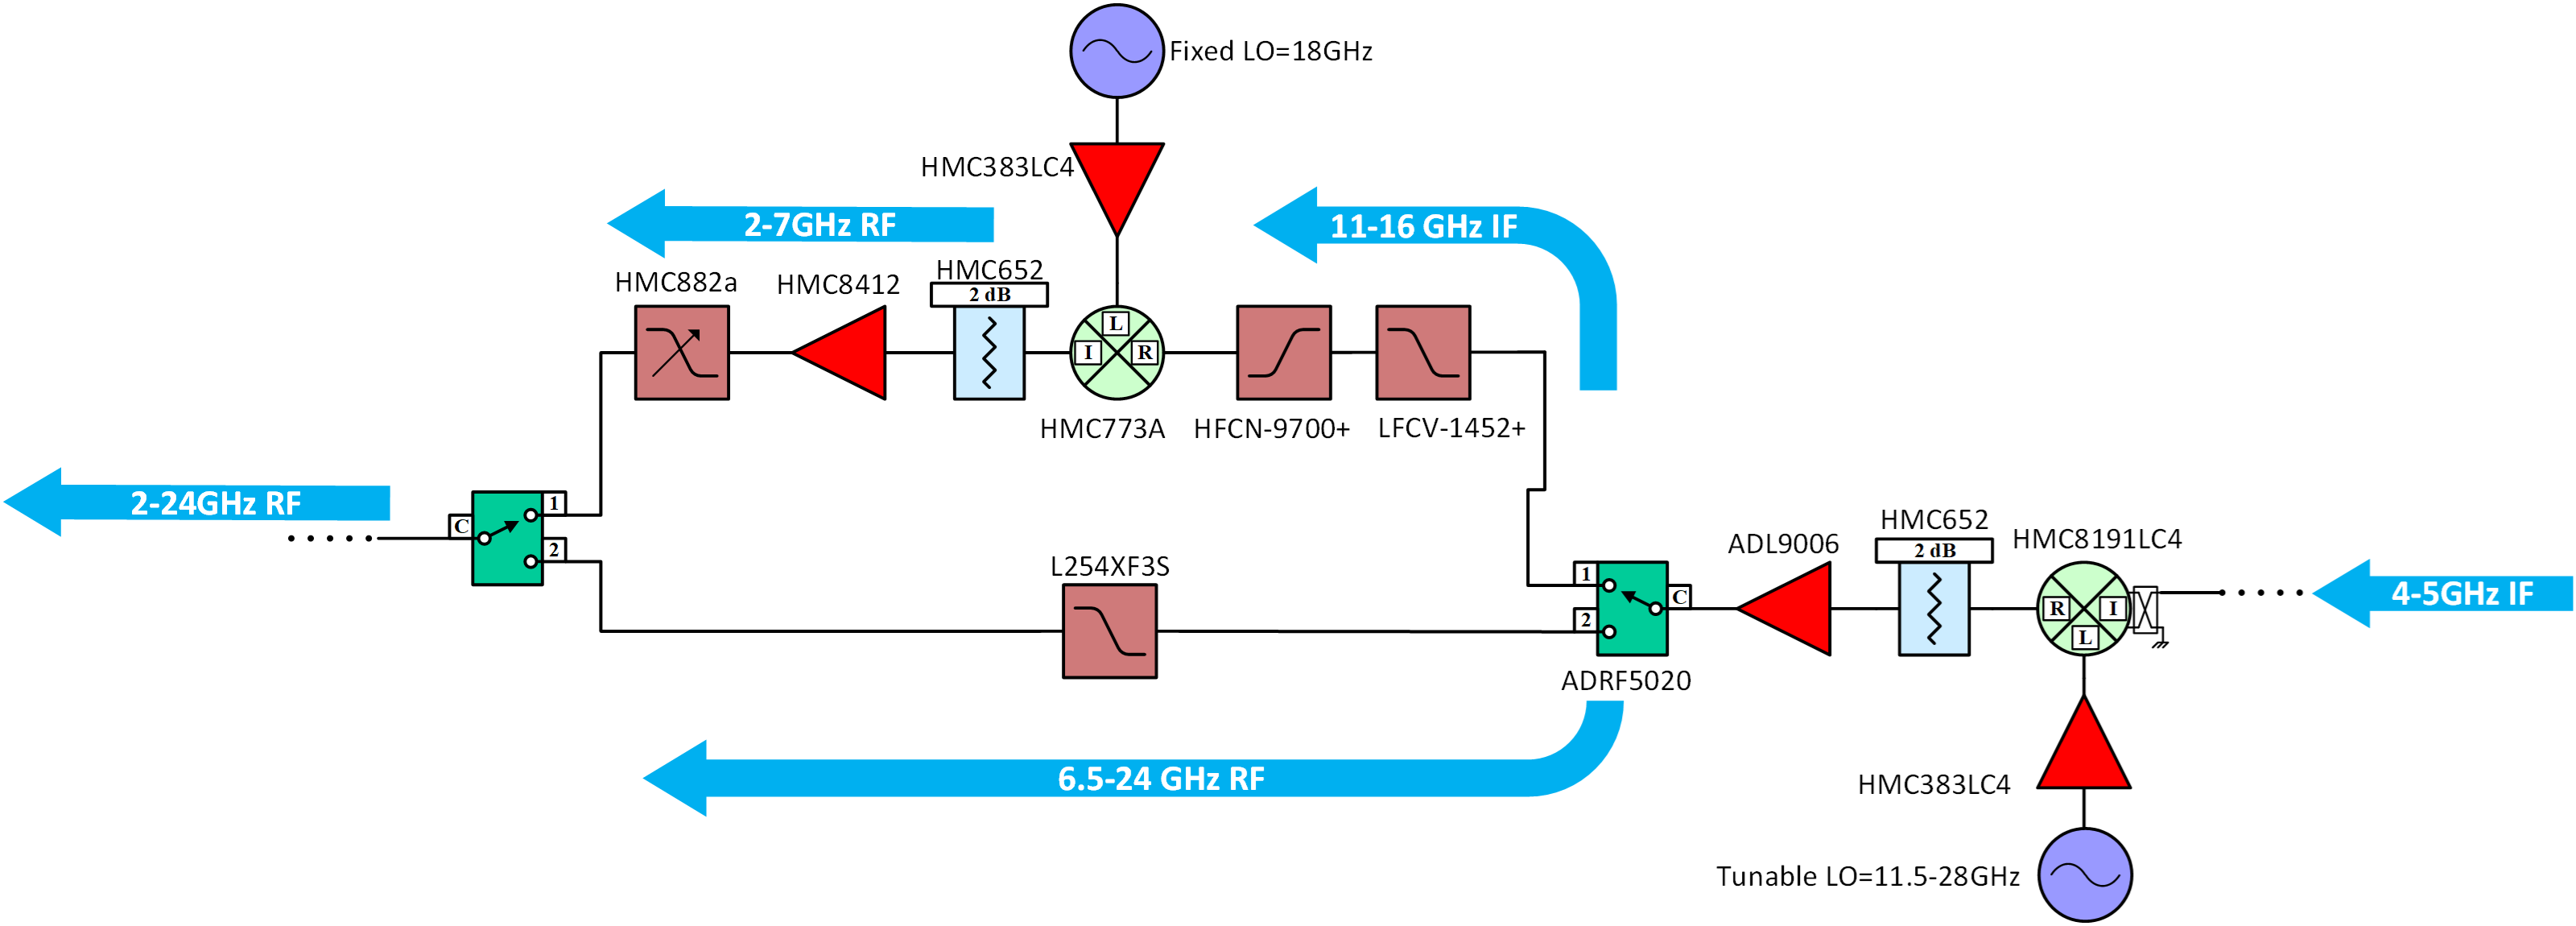
Transmitter output spectrum, +12 dBm out at 12.5 GHz.
The following plot shows the spectral output power components of the transmitter at +12 dBm input power and 12.5 GHz frequency: