ADALM-PLUTO Transmit
Transmit Architecture
The AD9363 transmit chain is based on Direct Conversion techniques.
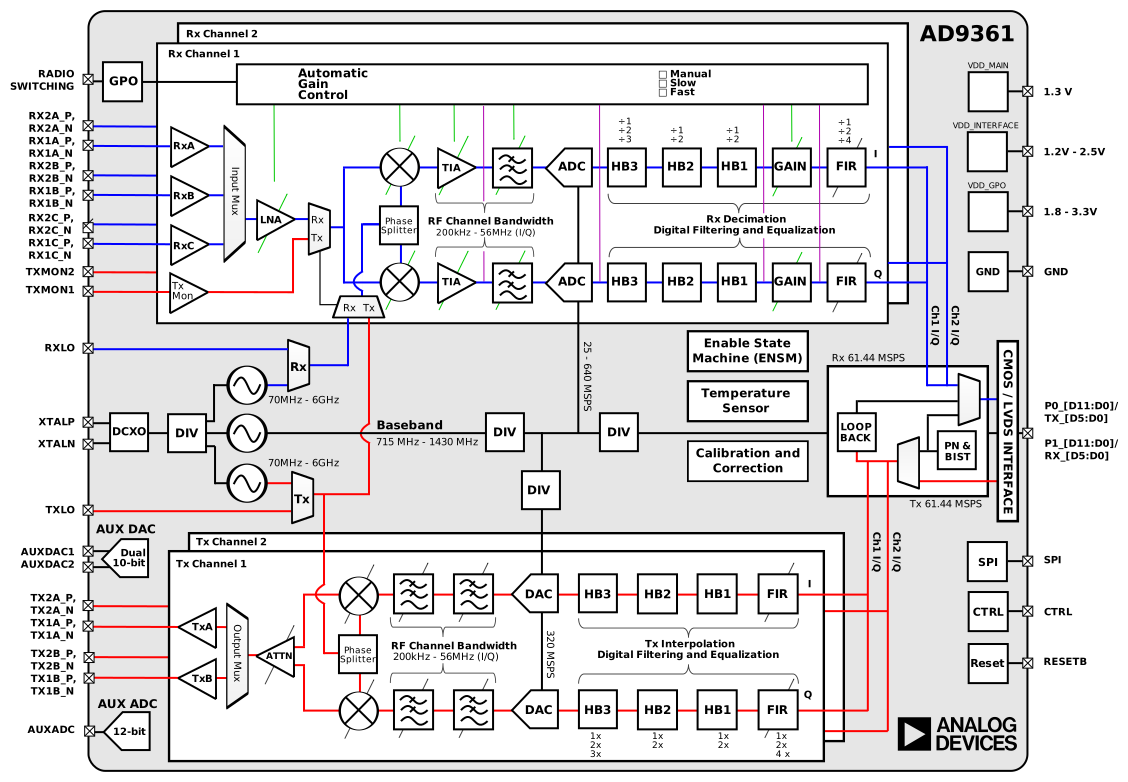
The Tx LO maintains constant amplitude, so optimal Signal-to-LO ratio requires running DACs near full scale, then adjusting output attenuation to control signal strength rather than reducing DAC input. Full scale into the DAC is 12 bits, though the HDL from ADI requires a 16-bit signal with lower 4 LSBs removed.
Transmit Performance
Two primary performance aspects are output power (transmission range) and output fidelity (transmission accuracy). Both are frequency dependent for the ADALM-PLUTO.
Transmit Power
Most modern spectrum analyzers allow measurement of power within a frequency range called the channel bandwidth. Such analyzers make many small power measurements \(p_i\) across a frequency range. They average these power measurements to calculate a desired channel power over a desired frequency range using the following equation:
Where \(P_{CH}\) is the power in the channel, \(B_S\) is the specified bandwidth (also known as the channel bandwidth), \(B_N\) is the equivalent noise bandwidth of the resolution bandwidth (RBW) used, \(N\) is the number of data points in the summation, \(p_i\) is the sample of the power in measurement \(i\) in dB units (if \(p_i\) is in dBm, \(P_{CH}\) is in milliwatts). \(n_1\) and \(n_2\) are the end-points for the index \(i\) within the channel bandwidth, thus \(N = (n_2 - n_1) + 1\) [3].
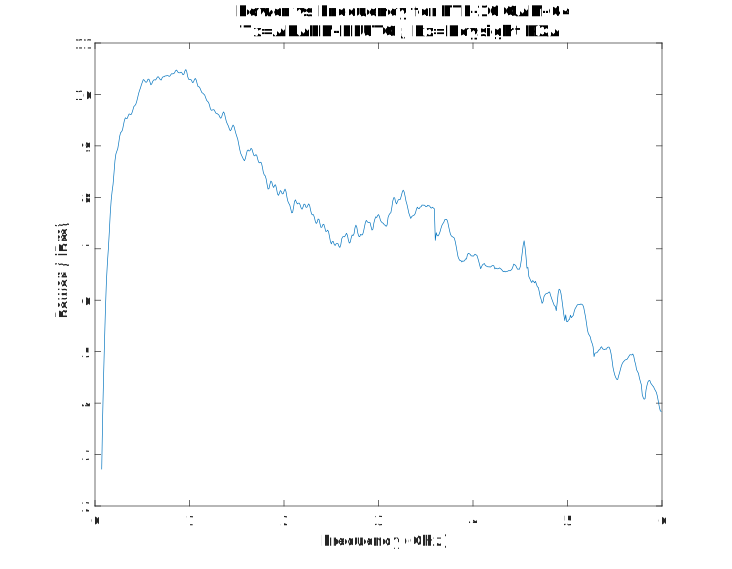
For this test an LTE10 signal was transmitted at various LO frequencies, and the power in the 9 MHz channel was measured and recorded:
This differs from a continuous sine wave (CW) at various LOs, where the LO was swept from 70 MHz to 6 GHz. This is not measuring power in the channel, just peak transmit power (the spectrum analyzer was set up to do a peak hold). The two graphs show the difference between the Tx attenuation settings. The default setting of -10dB ensures that the analog output stages are running completely in the linear range, and will not saturate or come close to the 1dB compression point. It is also safe at this setting to loop the Tx directly into the Rx with an SMA cable.
Warning
Do not set the TX attenuation to anything less than -10dB and loop the Tx (output) signal into the Rx (input) connector.
However, using the AD9361 or any SDR should be calibrated before attempting any measurement in absolute units. This is necessary since data that is provided from the AD9361 is in reference to the full scale range of the ADC which is dependent on the gain stages of the transceiver. The values produced are therefore best described in dBFS or ADC codes, and not dBm or volts.
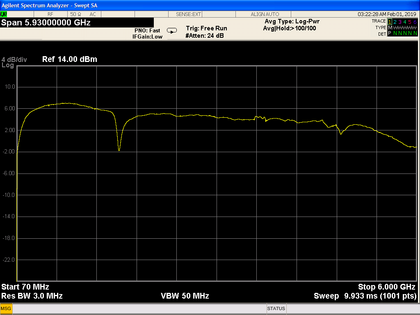
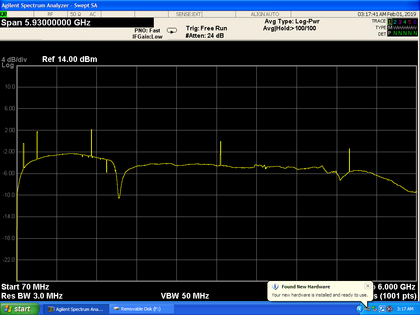
The random peaks in the -10 dB attenuation settings are (likely) random noise caused by the Tx calibrations when the LO changes by more than 100 MHz.
As expected, the wider LTE10 channel measurement has more power in it than a narrow CW signal.
Transmit Fidelity
This is the output of the Keysight 89600 VSA software, which is used to measure signal demodulation and complete vector signal analysis. In this case, we generate an LTE 10 (10MHz wide channel), and transmit it out the Tx port of the ADALM-PLUTO, and capture it on the PXA N9030A Signal Analyzer. We can measure the RF offset (frequency error = 50Hz), and how accurate the 64-QAM constellation is created (an EVM of -46dB, or less than 0.5% RMS error) – which is pretty good. We can also see the output power (average peak output for the 10MHz channel is -45dBm/Hz).
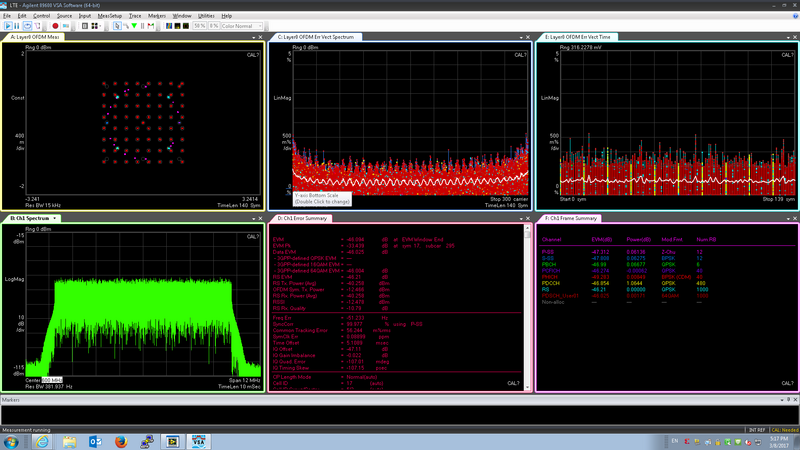
By changing the LO frequency, output power, output attenuation, these results will change.
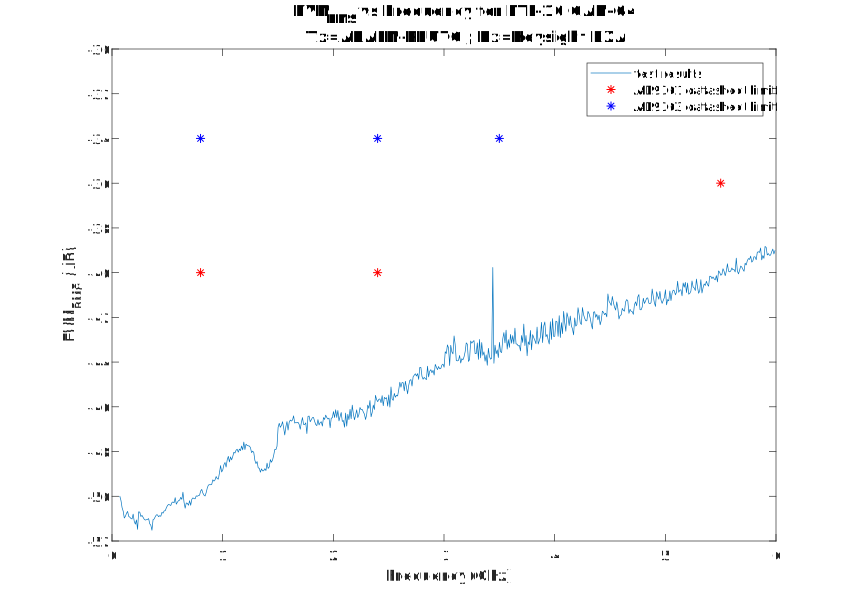
Important
This is power out the SMA, not the antenna. Any antenna (including the one provided in the kit) may provide additional filtering (change the shape), as well as gain/attenuation.
This test was done in an open lab setting and as a result we can observe degradation at certain common commercial frequencies like LTE and WiFi. To remove these outliers the tests should be run inside an RF chamber, to make sure there is no external noise, but since we meet datasheet specifications, we are unlikely to.