Turbidity Measurement Demo
The EVAL-ADPD410x-ARDZ allows users to take advantage of the flexibility of the ADPD4100 and ADPD4101 as multimodal sensor front ends to a wide range of applications. One example of a specialized application is the CN0409, a reference design for turbidity measurement. This demonstration shows how to measure turbidity using a similar method, but using the EVAL-ADPD410x-ARDZ.
General Description/Overview
The International Organization for Standardization (ISO) developed a design standard known as ISO 7027 Water Quality—Determination of Turbidity, which is best known for its requirement of a monochromatic light source. Most instruments that comply with this standard use an 860 nm LED light source and a primary detector at an angle of 90°. Additional detection angles are allowed, such as a detector at an angle of 180°, to increase the range of measurable turbidity levels.
The demo uses a network of 860 nm infrared emitters and silicon PIN photodiodes to achieve a water turbidity measurement system. The system can measure low to high water turbidity levels ranging from 0 FTU to 1000 FTU.
Demo Requirements
The following is a list of items needed to replicate this demo:
EVAL-ADICUP3029 with firmware (see Firmware Setup)
Host computer with PyADI-IIO and relevant dependencies installed (See EVAL-ADPD410X-ARDZ Python Example)
Type 1FLP Disposable Macro Cuvettes UV Plastic (Lightpath: 10 mm)
6 x Female-to-Female Jumper Headers for Connection
(Optional) Samples with known turbidity concentration
Setting up the EVAL-ADPD410X-ARDZ
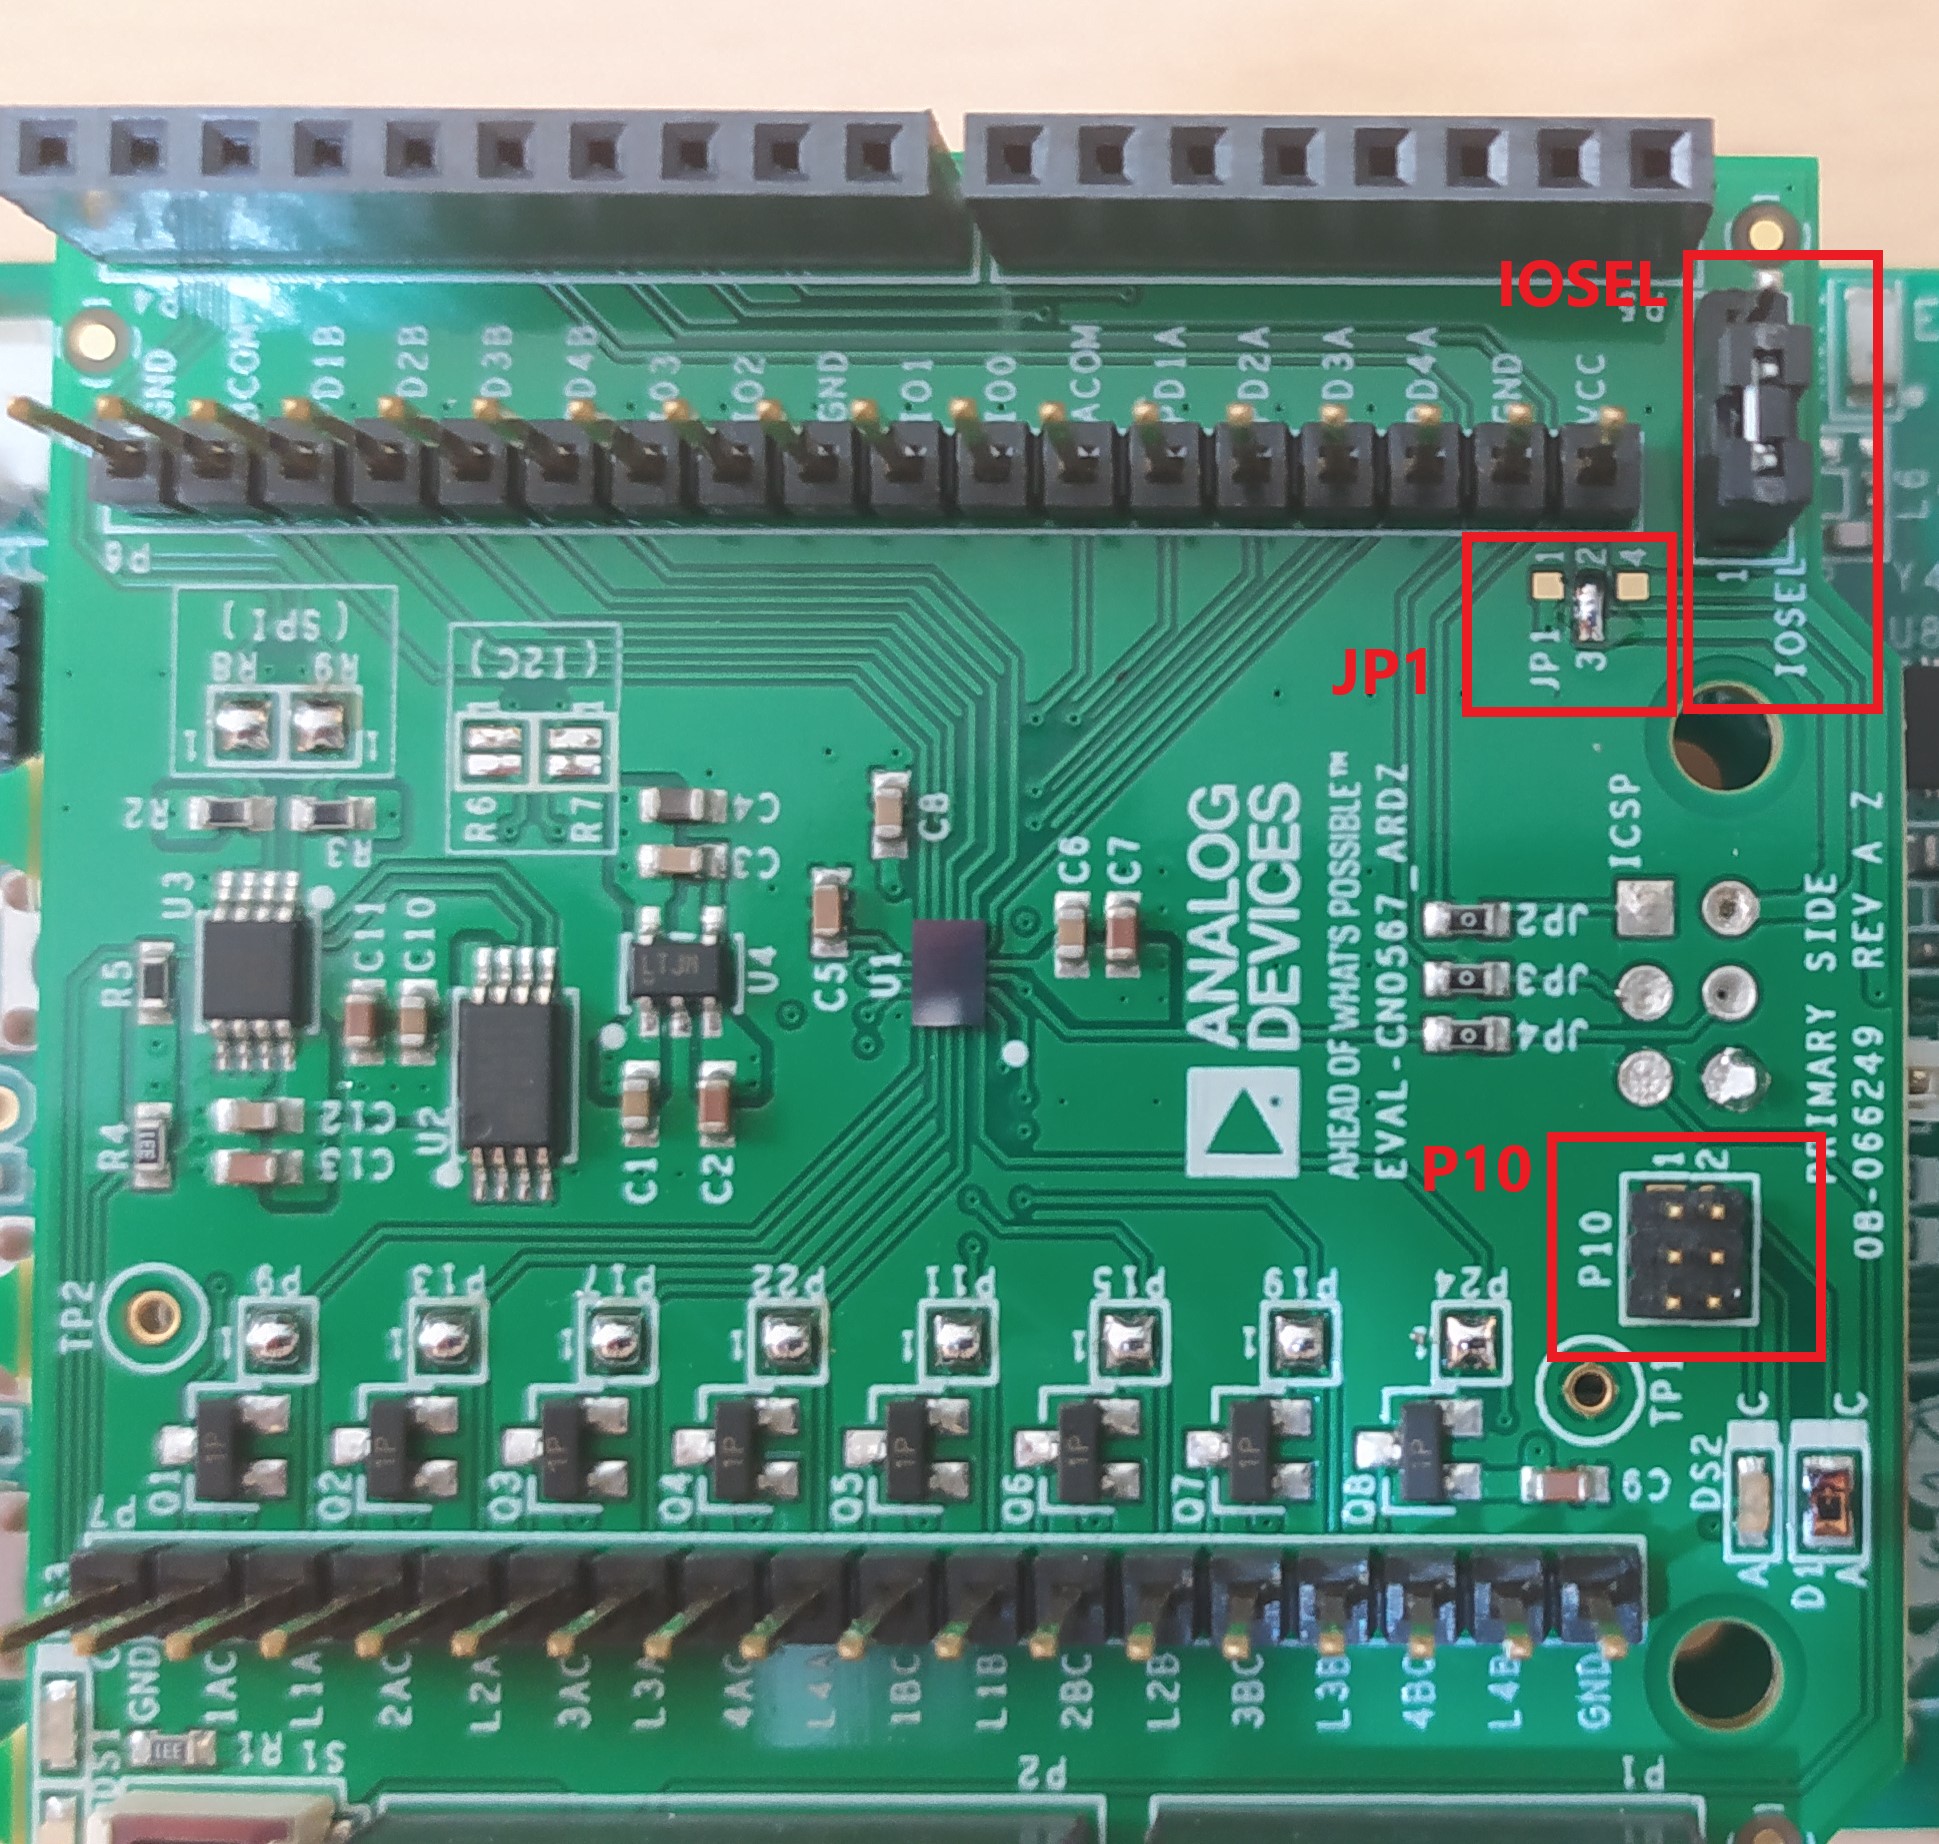
Configure the onboard jumper header and solder jumper connections, as shown below.
Header |
Setting |
Image |
|---|---|---|
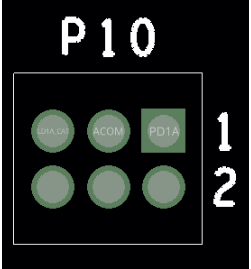
P10 |
No connection |
|
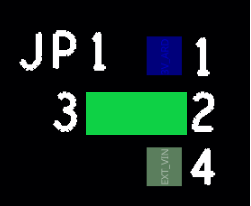
JP1 |
Shorted Pin 2 and Pin 3 |
|
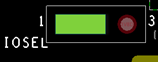
IOSEL |
Shorted Pin 1 and 2 |
|
Set the following EVAL-ADICUP3029 switches according to their configuration on the table below.
Switch |
Configuration |
|---|---|
UART (S2) |
USB |
POWER (S5) |
WALL/USB |
Connect the EVAL-ADPD410x-ARDZ to the EVAL-ADICUP3029 using the headers, as shown below.
Firmware Setup
Connect the EVAL-ADICUP3029 to the PC using the micro USB to USB cable.
Drag and drop the appropriate HEX file from the list below to the DAPlink drive (see Firmware Setup)
Download
Pre-built HEX files can be found here:
EVAL-ADPD4100-ARDZ HEX File (ADuCM3029_demo_adpd410x_spi_waterquality.hex)
EVAL-ADPD4101-ARDZ HEX File (ADuCM3029_demo_adpd410x_i2c_waterquality.hex)
The latest source code can be found here:
DIY Test Board Setup
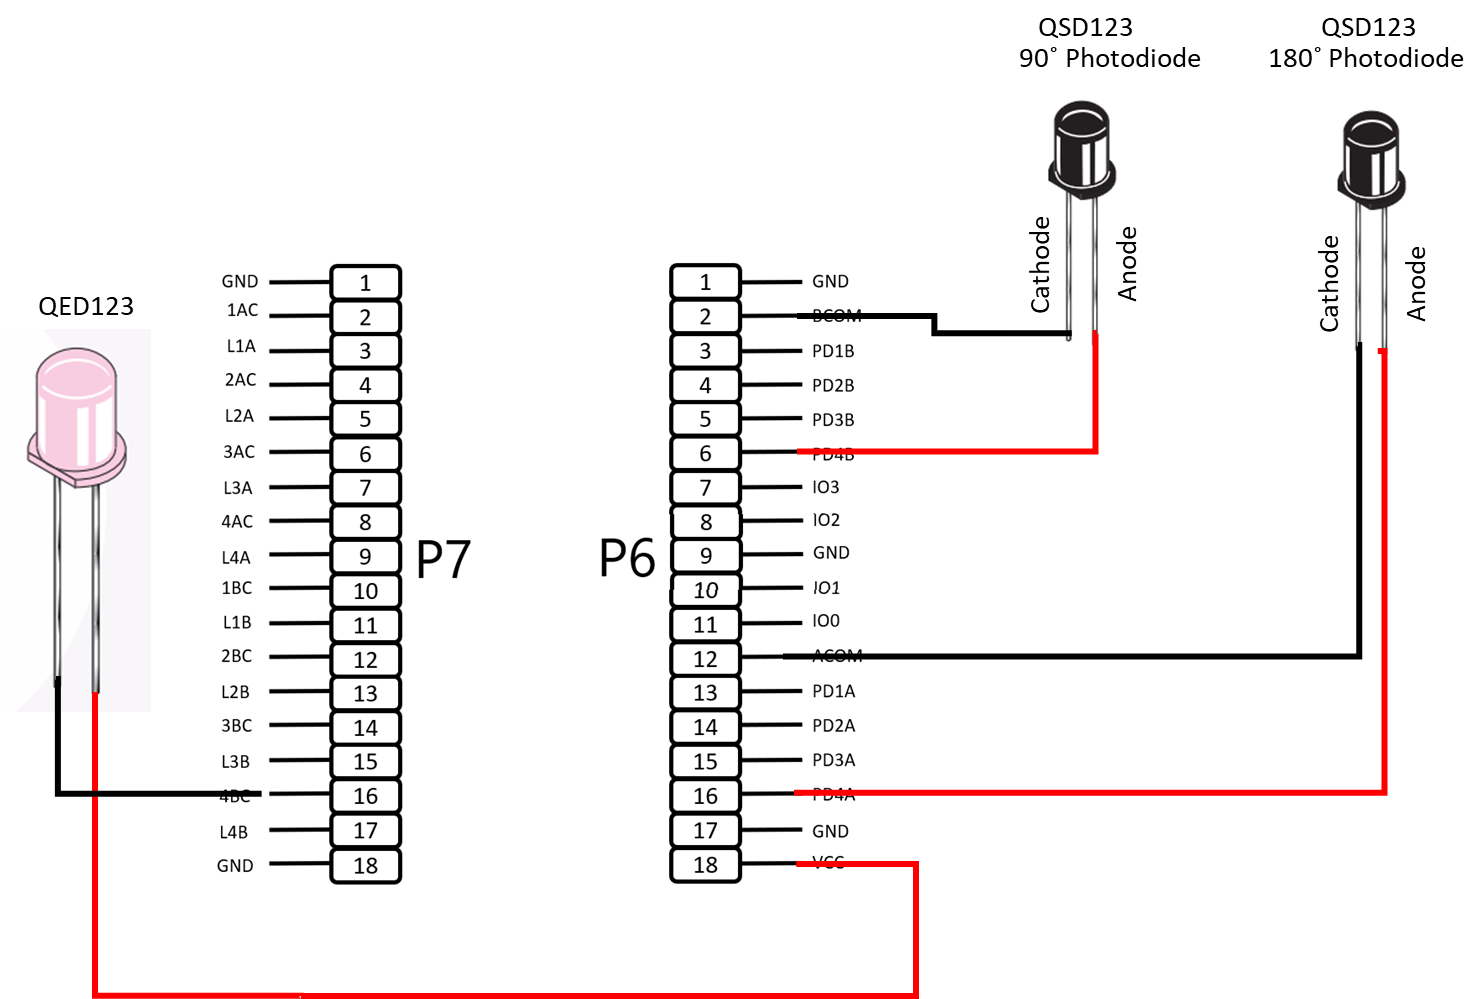
To set up the optical path, use the prototype board that comes in the box with the EVAL-ADPD410x-ARDZ as a base. The connection diagram for the QED123 LED and the two QSD123 is shown below:
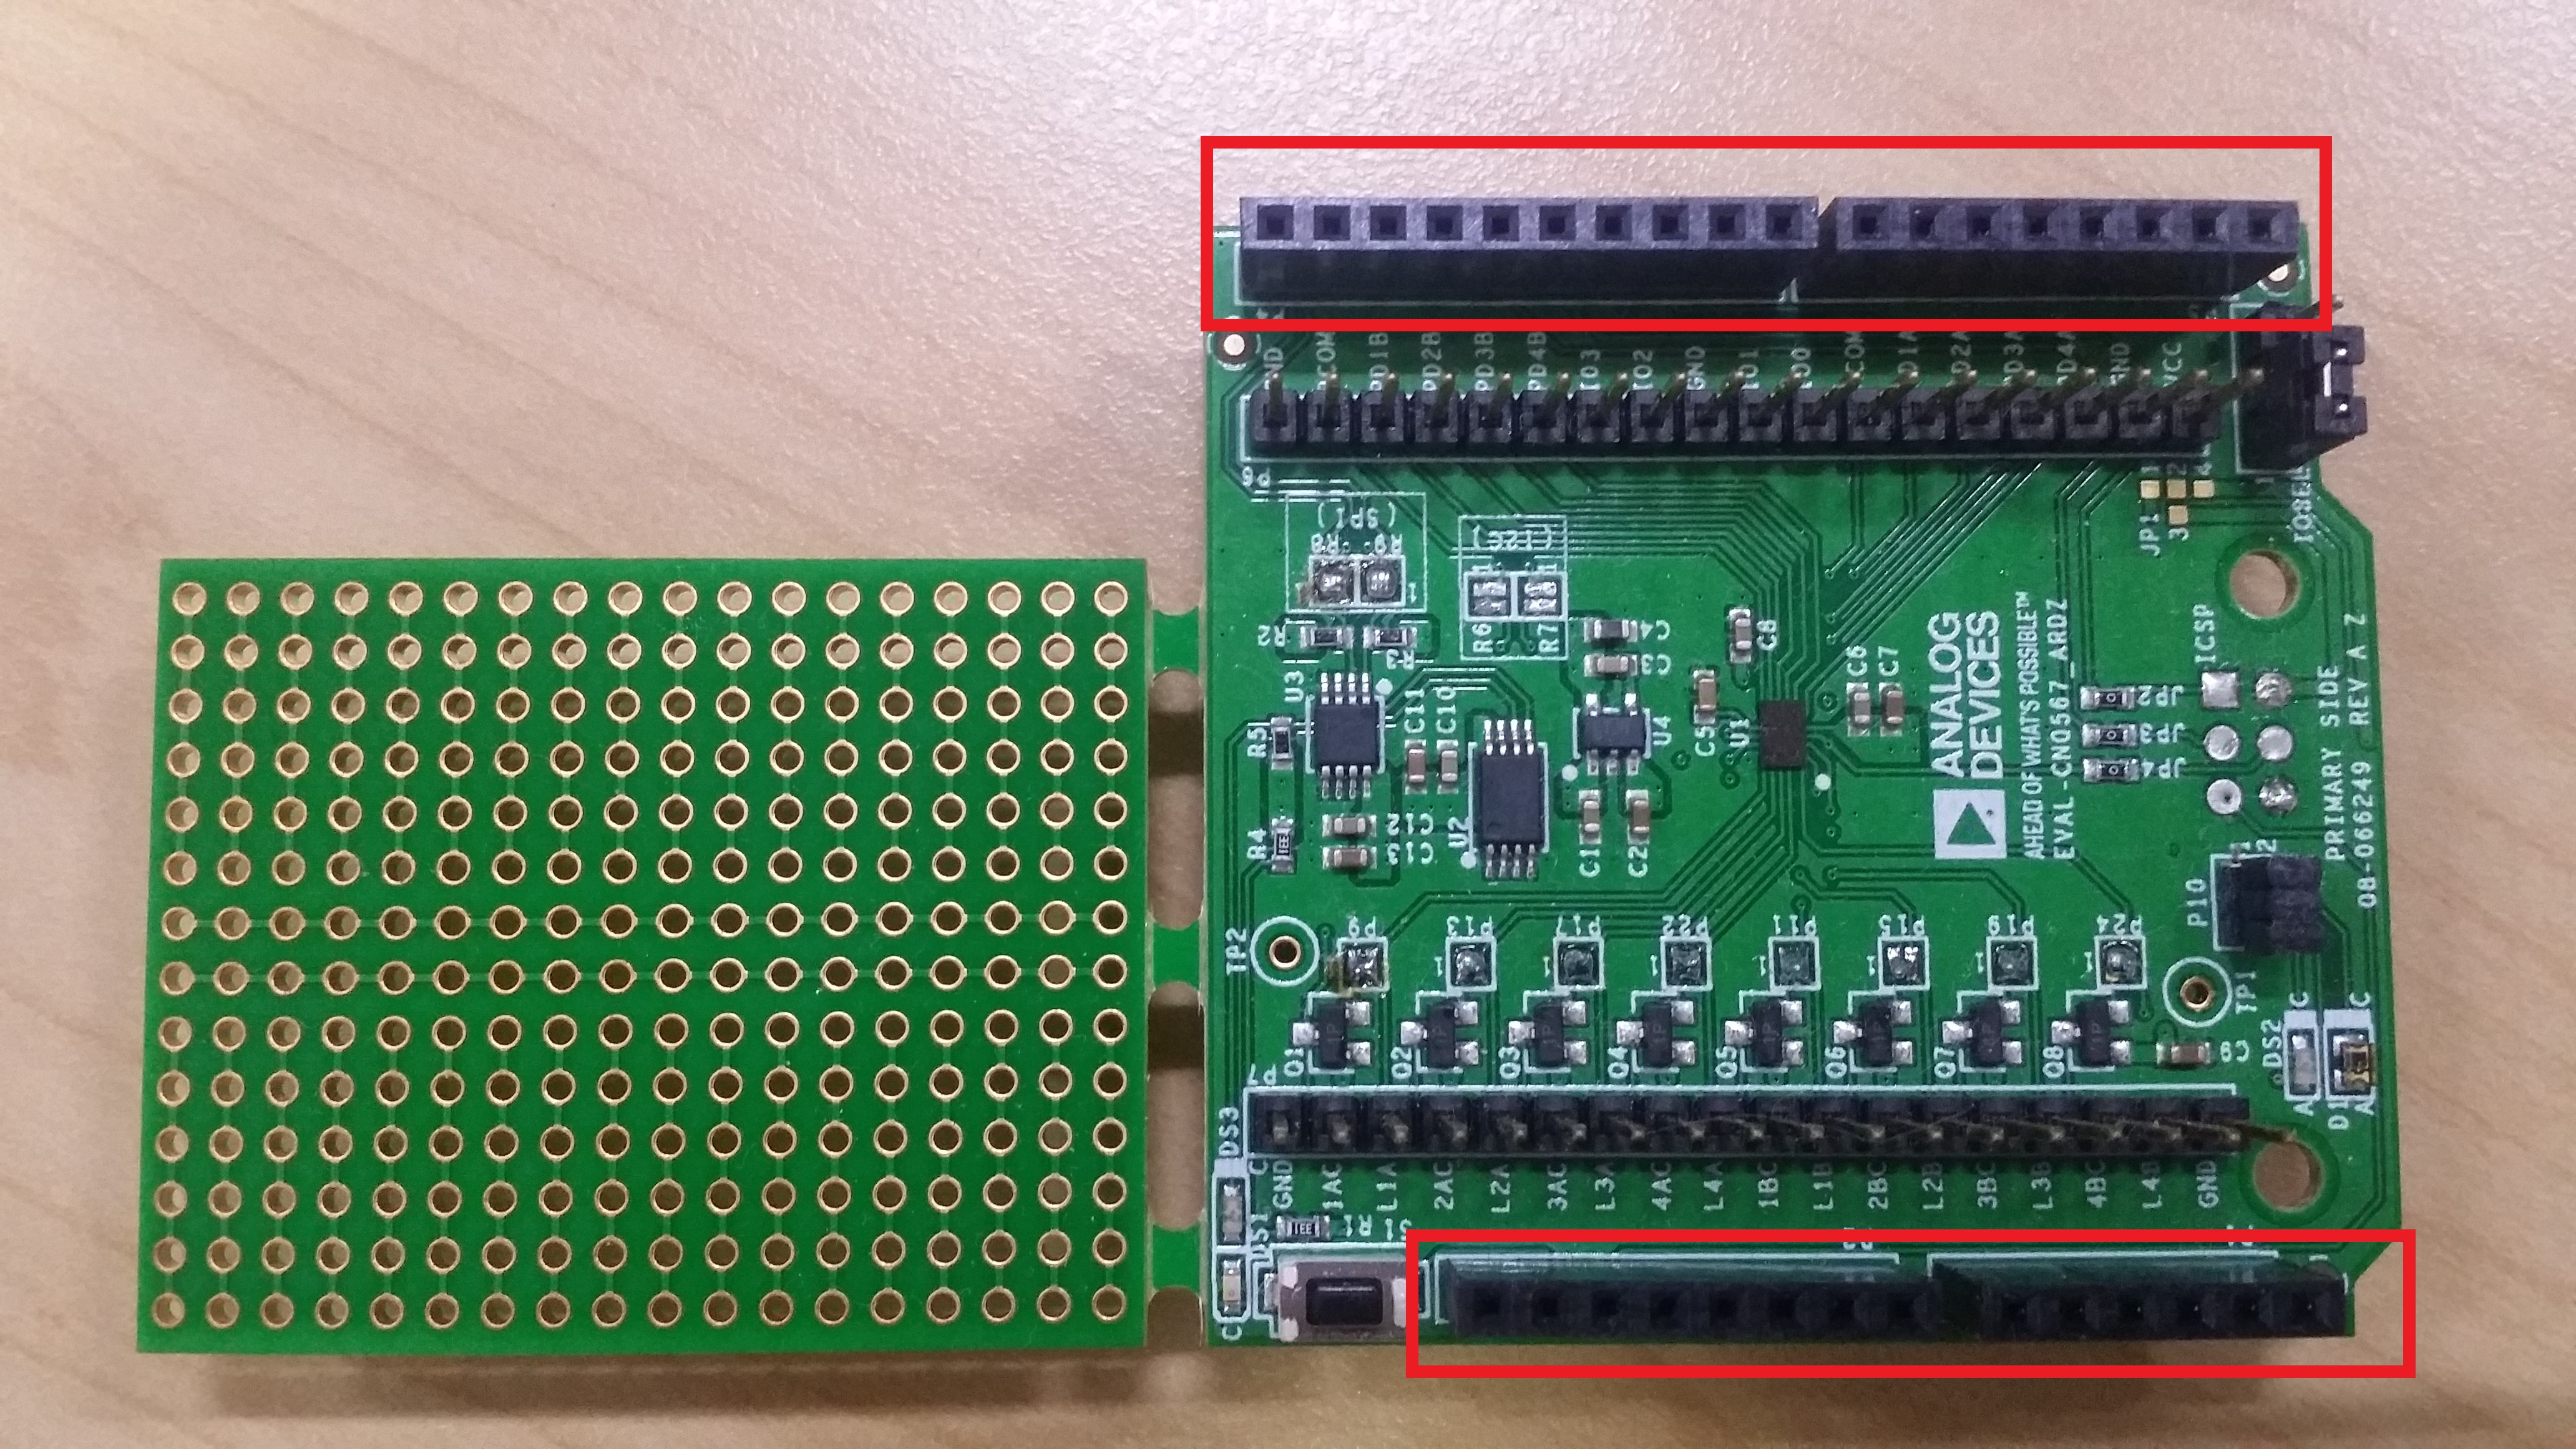
To connect to the EVAL-ADPD410x-ARDZ, solder the two 18-pin single row female headers at the bottom sides of the prototype board.
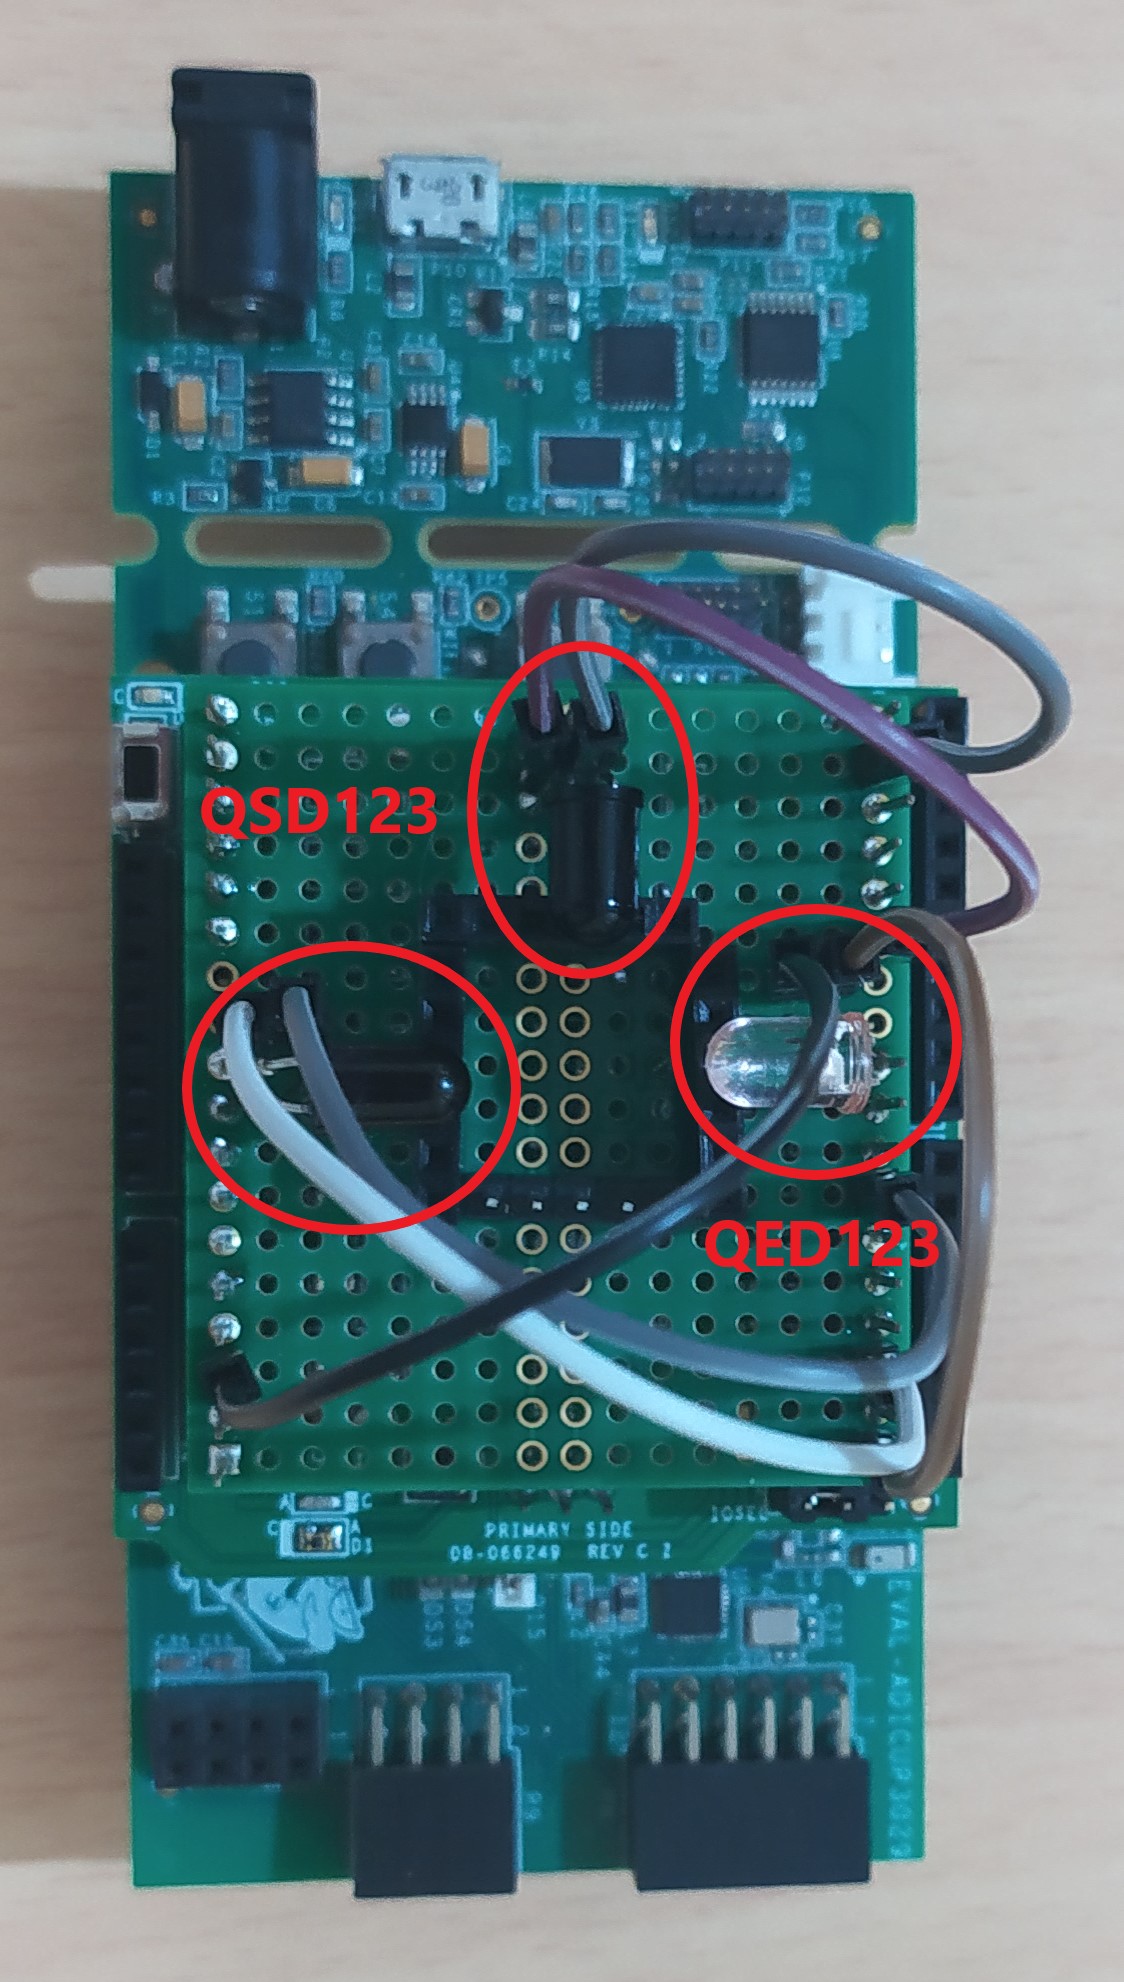
Solder the four 6-pin female headers enclosing a 5 x 5 pad space as a DIY cuvette holder.
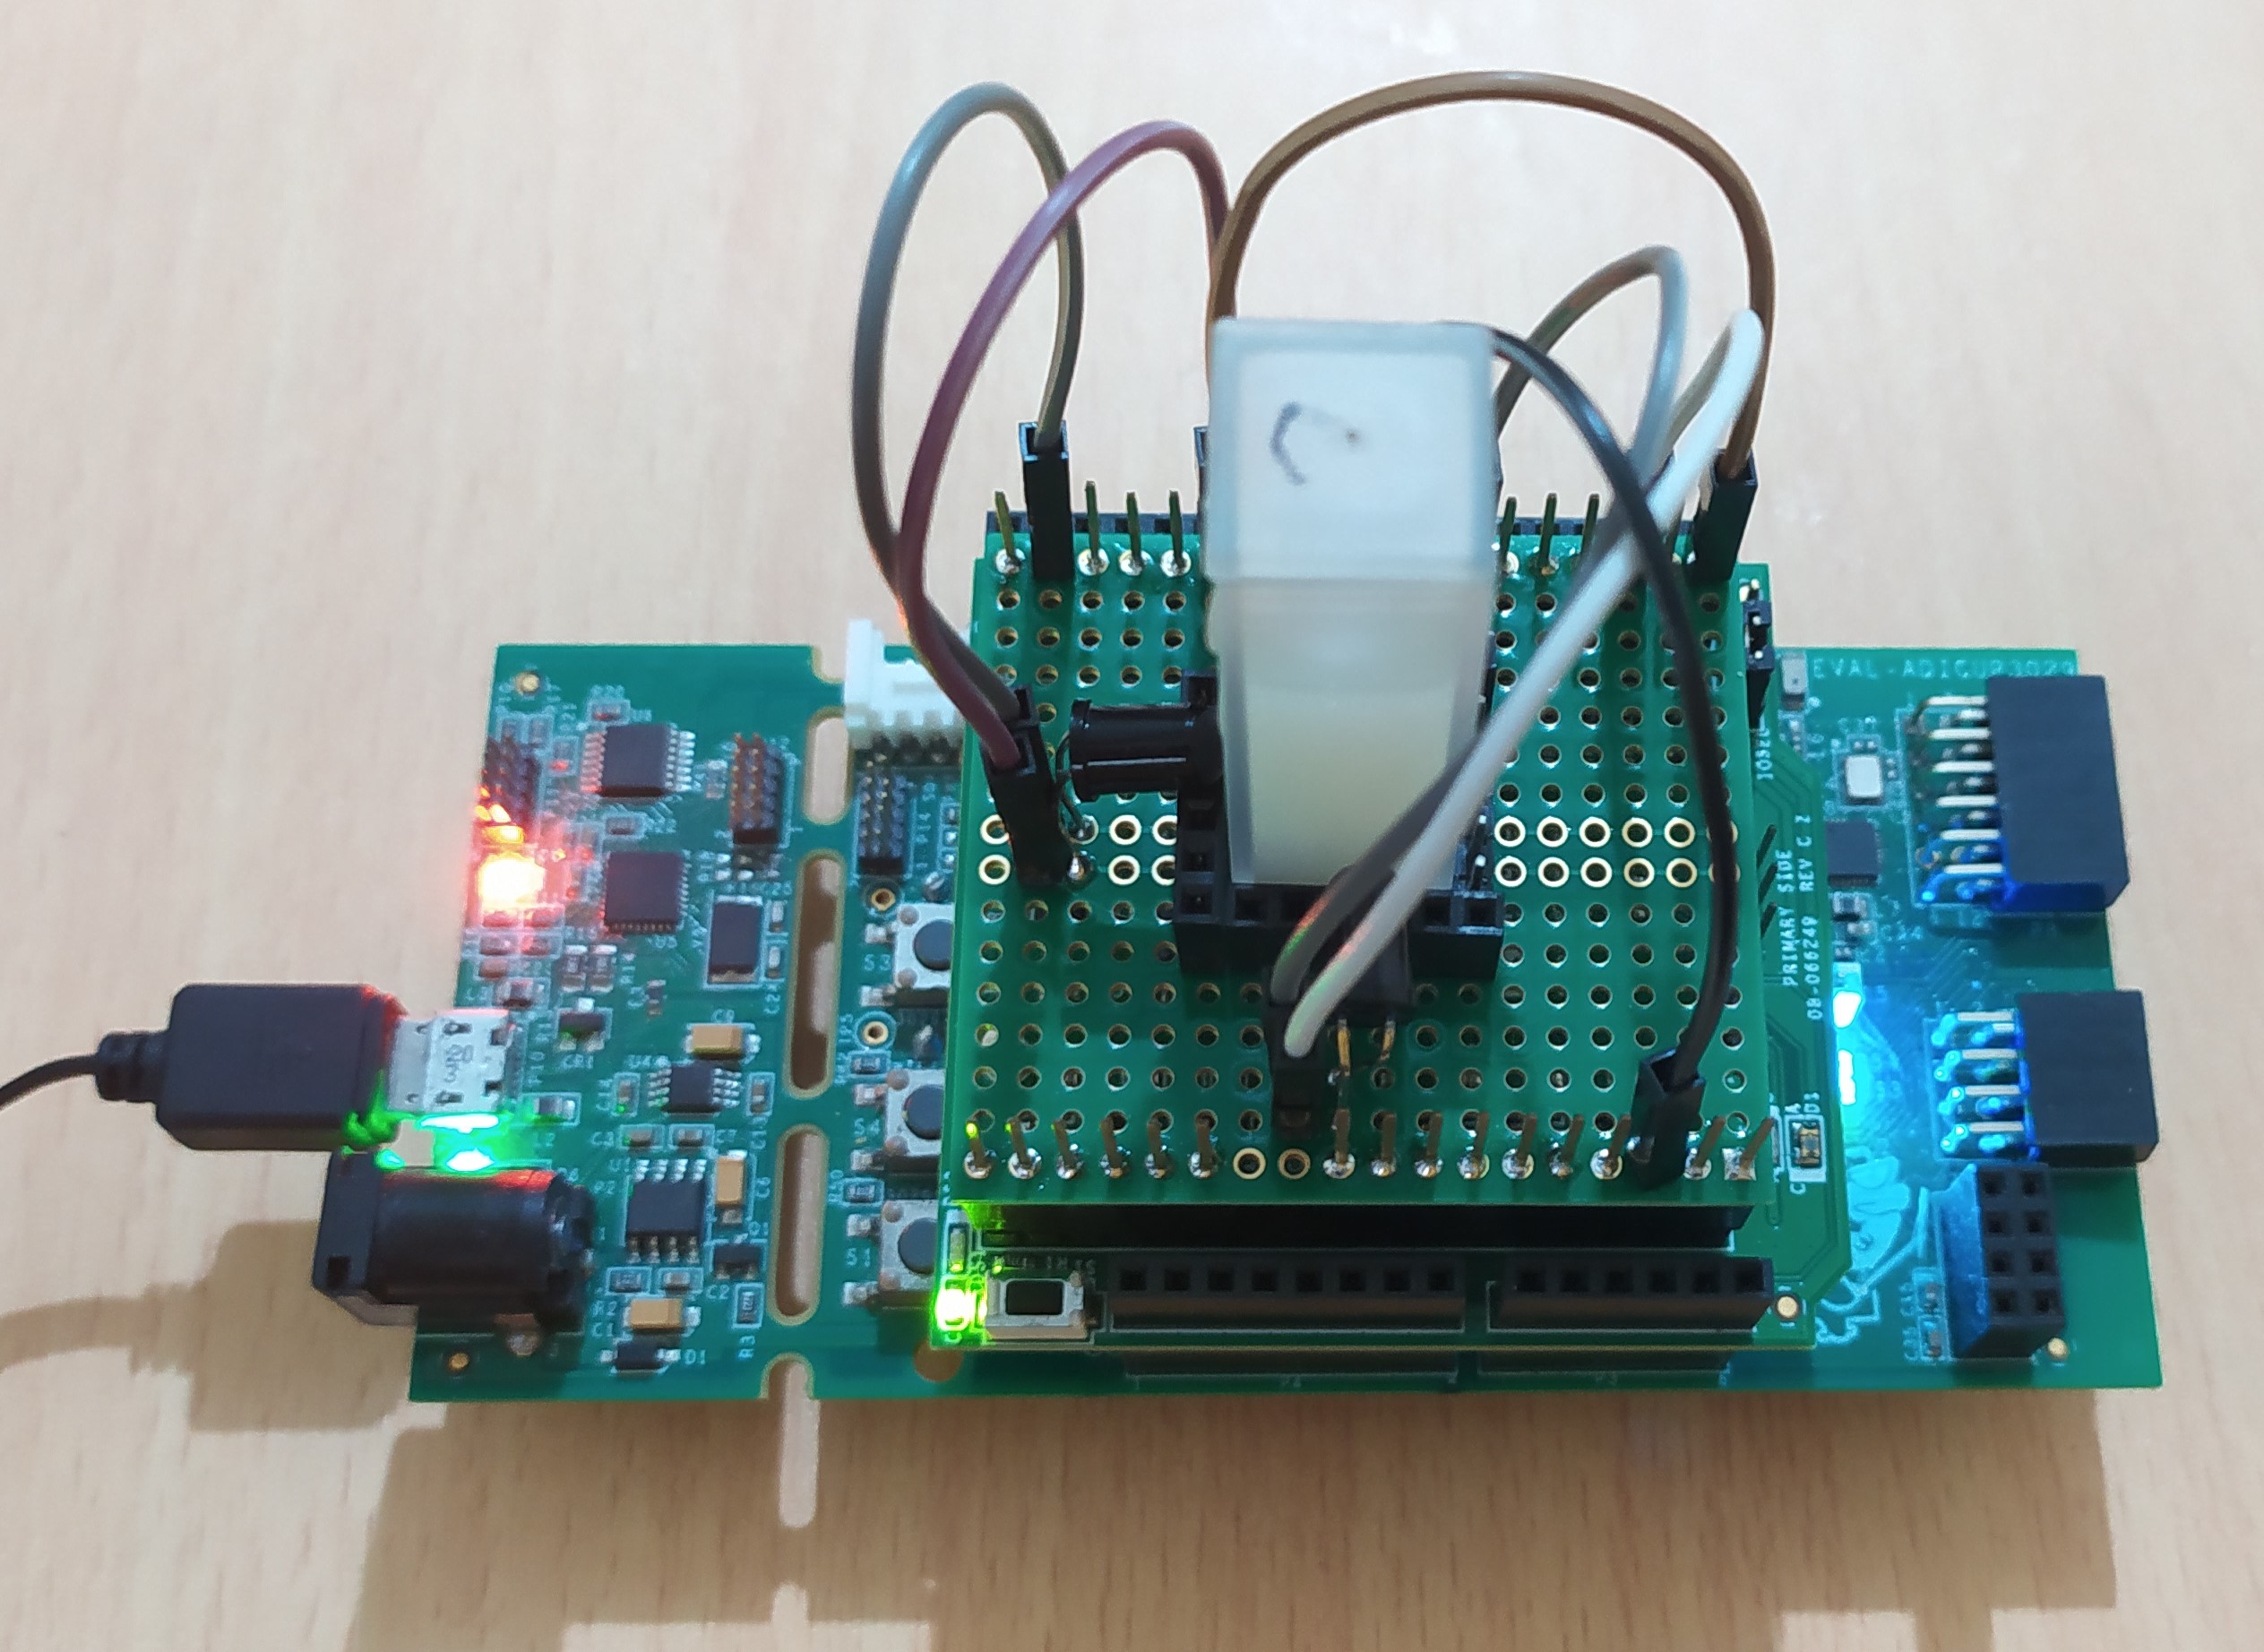
Solder the LEDs and photodiodes at 3 adjacent sides of the cuvette holder and directed inward. A photo of a completed test board setup mounted on the EVAL-ADPD410X-ARDZ and the EVAL-ADICUP3029 is shown below using Female-to-Female headers for connection.
You can place a sample placed in a cuvette to the square space at the center, as shown below.
Software Setup
This demo uses a PyADI-IIO example script. See Software Setup for the complete installation instructions from libiio to pyadi-iio.
Connect the EVAL-ADPD410x-ARDZ to the EVAL-ADICUP3029.
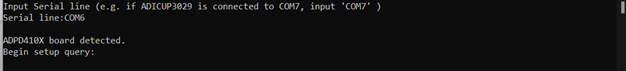
Connect the EVAL-ADICUP3029 to the PC using the micro USB cable and note the serial port from the Device Manager as in Connection.
Open command prompt or terminal and navigate through the examples folder inside the downloaded or cloned pyadi-iio directory.
Run the example script using the command.
...\pyadi-iio\examples>python adpd410x_demo.pyThe script will ask for a serial port. Input the noted serial port and press Enter. In cases when the board is not found, press the reset button (S1) on the EVAL-ADPD410x-ARDZ and input the noted serial port again.
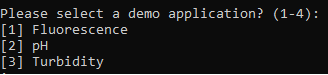
When the board is detected, you will be asked to specify the demo application to use. Since this setup is only applicable for turbidity measurements, enter 3.
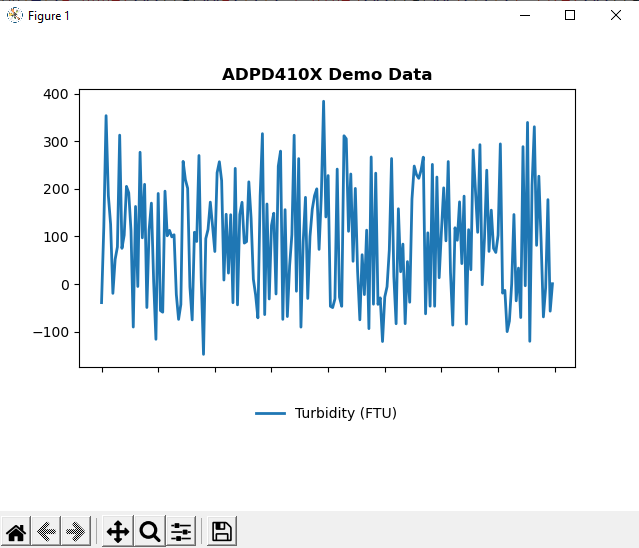
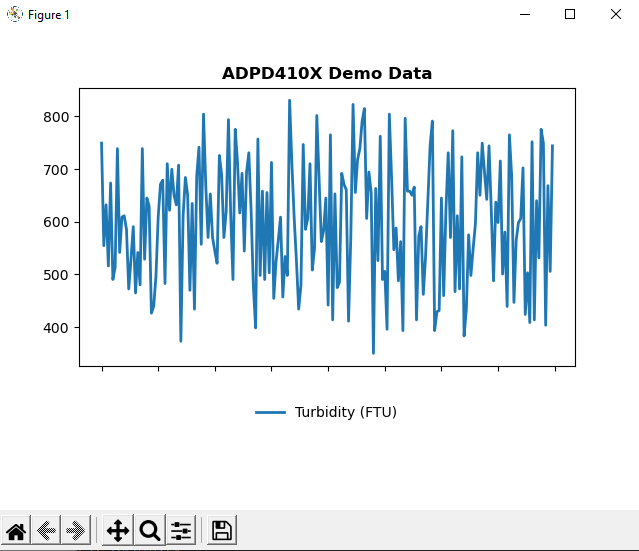
A plot will appear showing the measured and computed turbidity in FTU. You have the option to save a copy of the displayed waveform at any point in time using the matplotlib controls at the top. Remove the cuvette and replace the sample with a different turbidity to observe the measurement change.
Low Turbidity Sample
High Turbidity Sample
Important
The measurements obtained have not been tested and verified with the actual turbidity measurement, and is not expected to be accurate. The demo showcases a proof-of-concept DIY setup for turbidity measurement, which users can tweak and improve upon.
Important
The demo script uses the same approximation used in Linear Approximation using 3-Point Calibration.