MATLAB Script Execution
We are now ready to execute the "test_system_SystemPlatformsDemo.m" test script.
This script will verify that your hardware and software configurations are setup correctly ahead of any custom development or additional Pilot setup execution.
We will connect to the platform over 1GbE and initialise the system
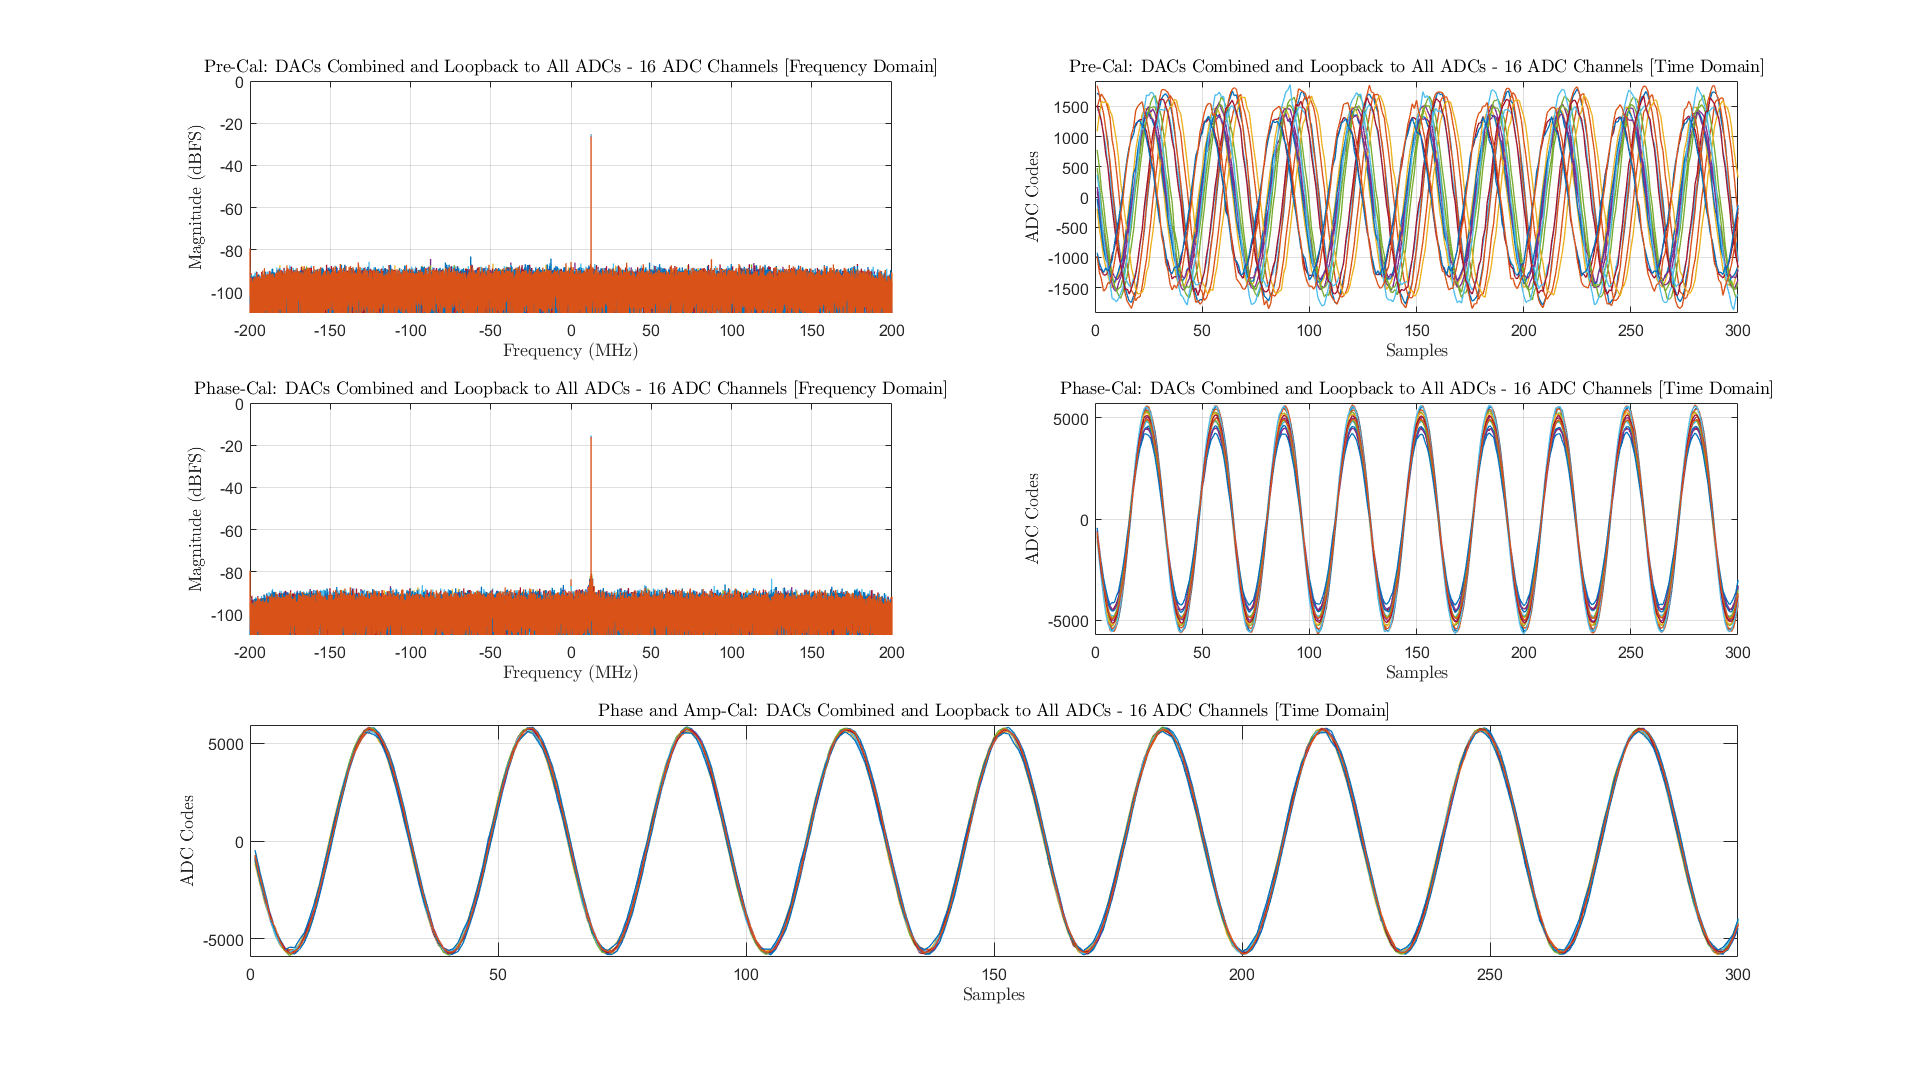
The script will be outputting a CW at 10 GHz from the 16 DACs and then using the Calibration Board we will combine these signals and then connect them to each of the 16 ADCs
With this captured ADC data, we will calibrate both Phase and Amplitude to result in ADC alignment across the system
The script will present the user with a summary plot of all the data, before and after the phase and amplitude calibrations
Once you have successfully run this script and received results similar to what you see at the bottom of this page, you can be confident that your Platform environment is setup correctly.
Before we execute the code, we will review the MATLAB code and explain what each section is doing.
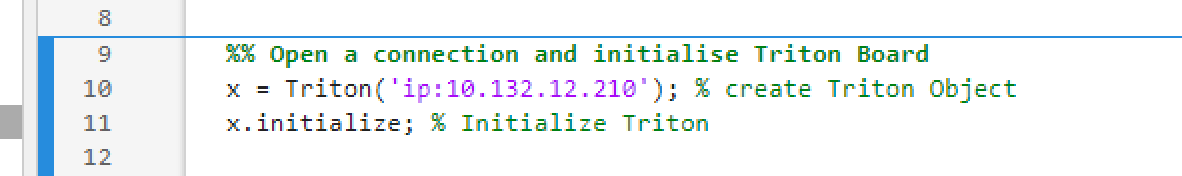
Step 1: The connection to Triton is opened and then we will execute an initialisation of the platform.
The IP Address will be edited in line 10 and the system initialised.
In line 14, the Triton Calibration Board will be setup for Combined Loopback. This will take the 16 DACs from Triton and combine them into a single signal and then push it to each of the 16 ADCs on the Platform.

Step 2: Create a Tx Vector at the baseband frequency
We create a waveform in line 17 using the code below

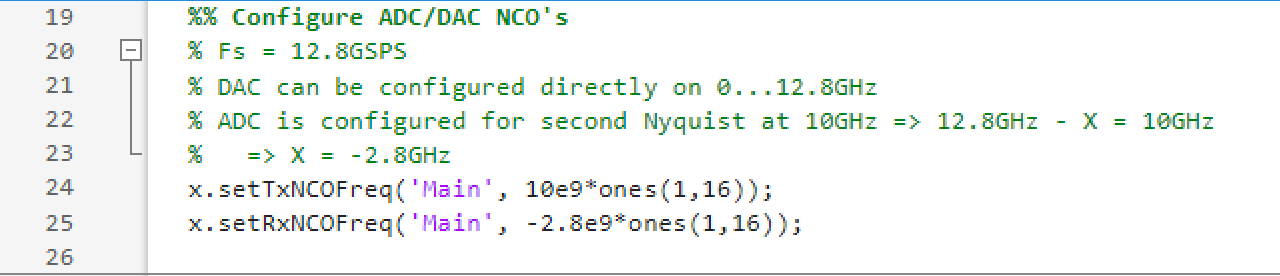
Step 3: NCO Configuration
In lines 24 and 25 we configure the Tx and Rx NCO frequencies
As we are running the DAC at 25.6 GSPS we can program the NCO at 10 GHz directly
The ADC is running at 12.8 GSPS so we need to configure this for the 2nd Nyquist and therefore set it to 10 GHz minus 12.8 GHz so we set it to -2.8 GHz
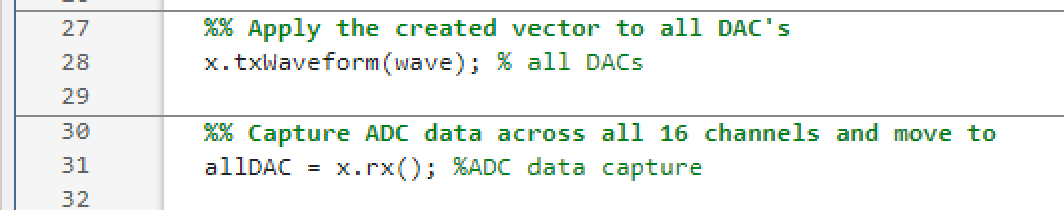
Step 4: Assign the DAC Waveform and Capture the ADC data
Line 28 shows the command to assign the waveform we created in Step 2 to the DAC
With the DAC now enabled, we execute an ADC capture in line 31
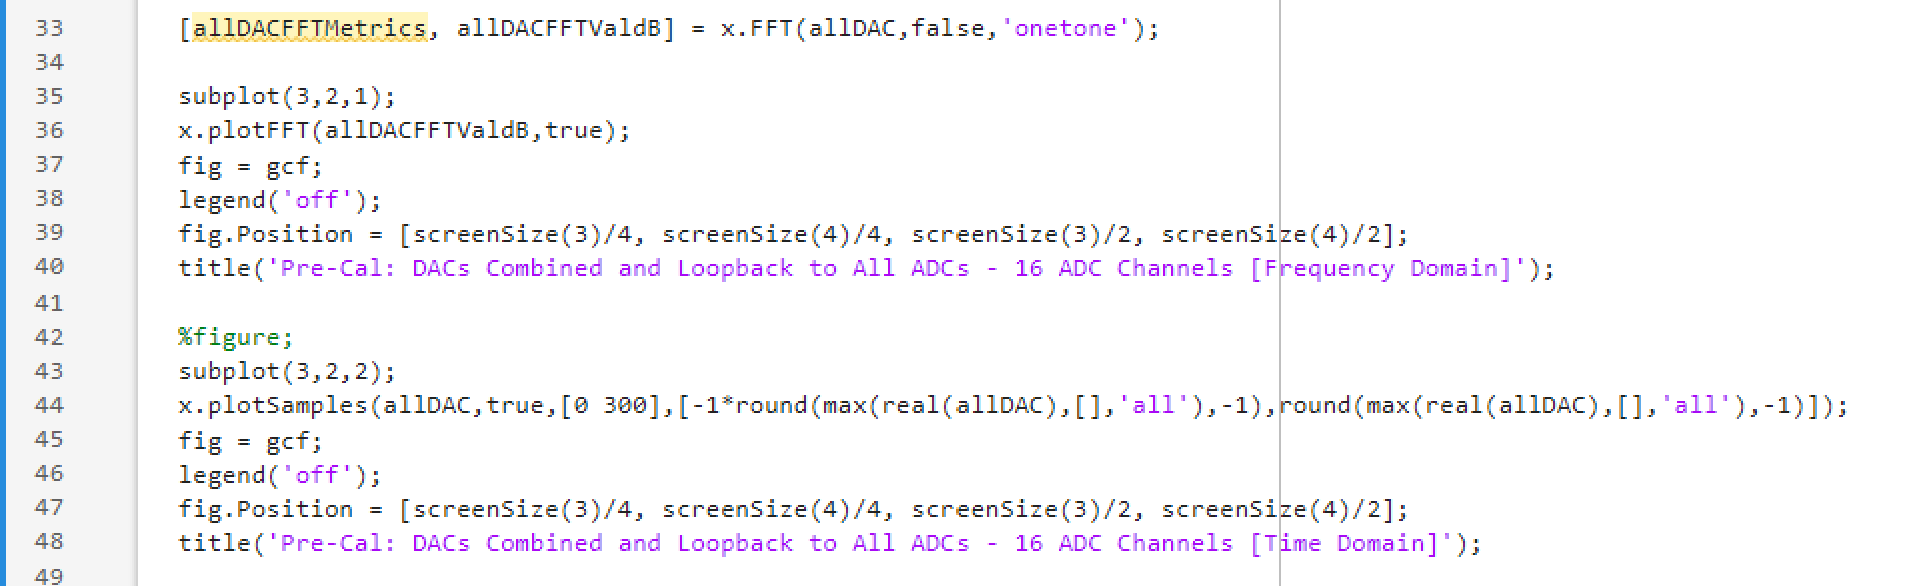
Step 5: Post processing of Pre-Calibration ADC data
Now that we have the ADC data, we will plot this in the time and frequency domain
Lines 35 through 40, is where we FFT the samples received
Lines 43 through 48 is where we plot the samples in time domain
You will see the results at the end of the page and we can see that there is no Phase or Amplitude alignment across the 16 channels
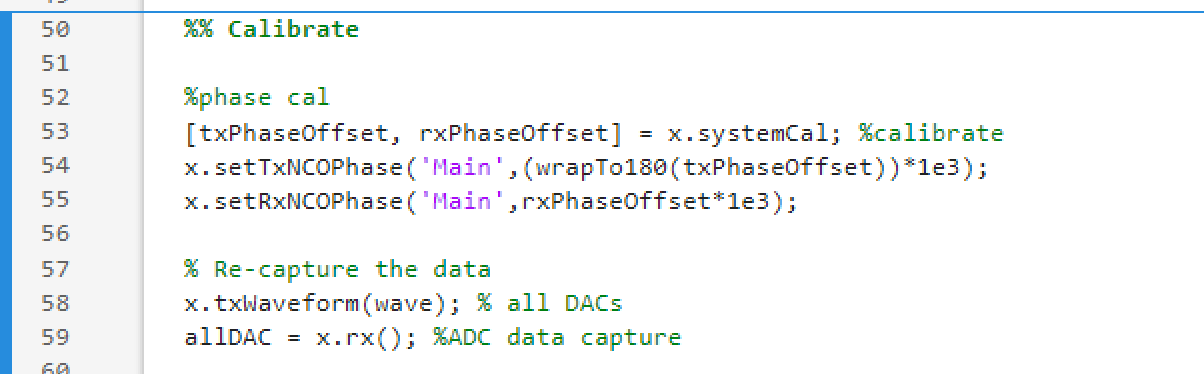
Step 6: Apply Phase Calibration to the ADC Data
We apply phase calibration algorithm at lines 53 through 55
After this in lines 58 and 59, we re-capture the ADC data to check if the Phase calibration has worked
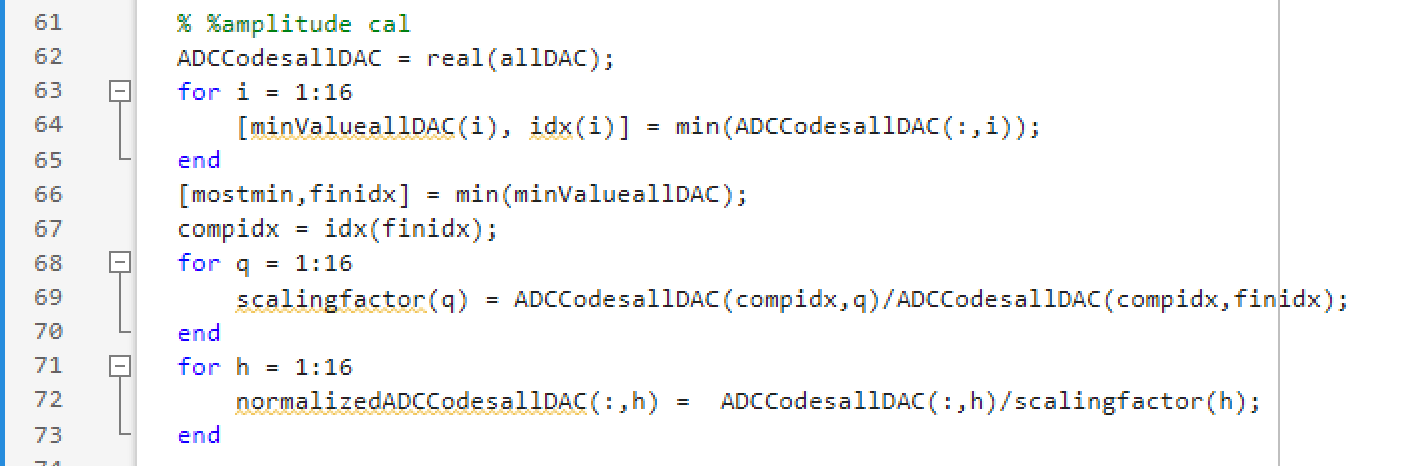
Step 7: Amplitude Calibration
Between lines 61 and 73, we normalise the amplitude of the ADC data so all received data is equalised
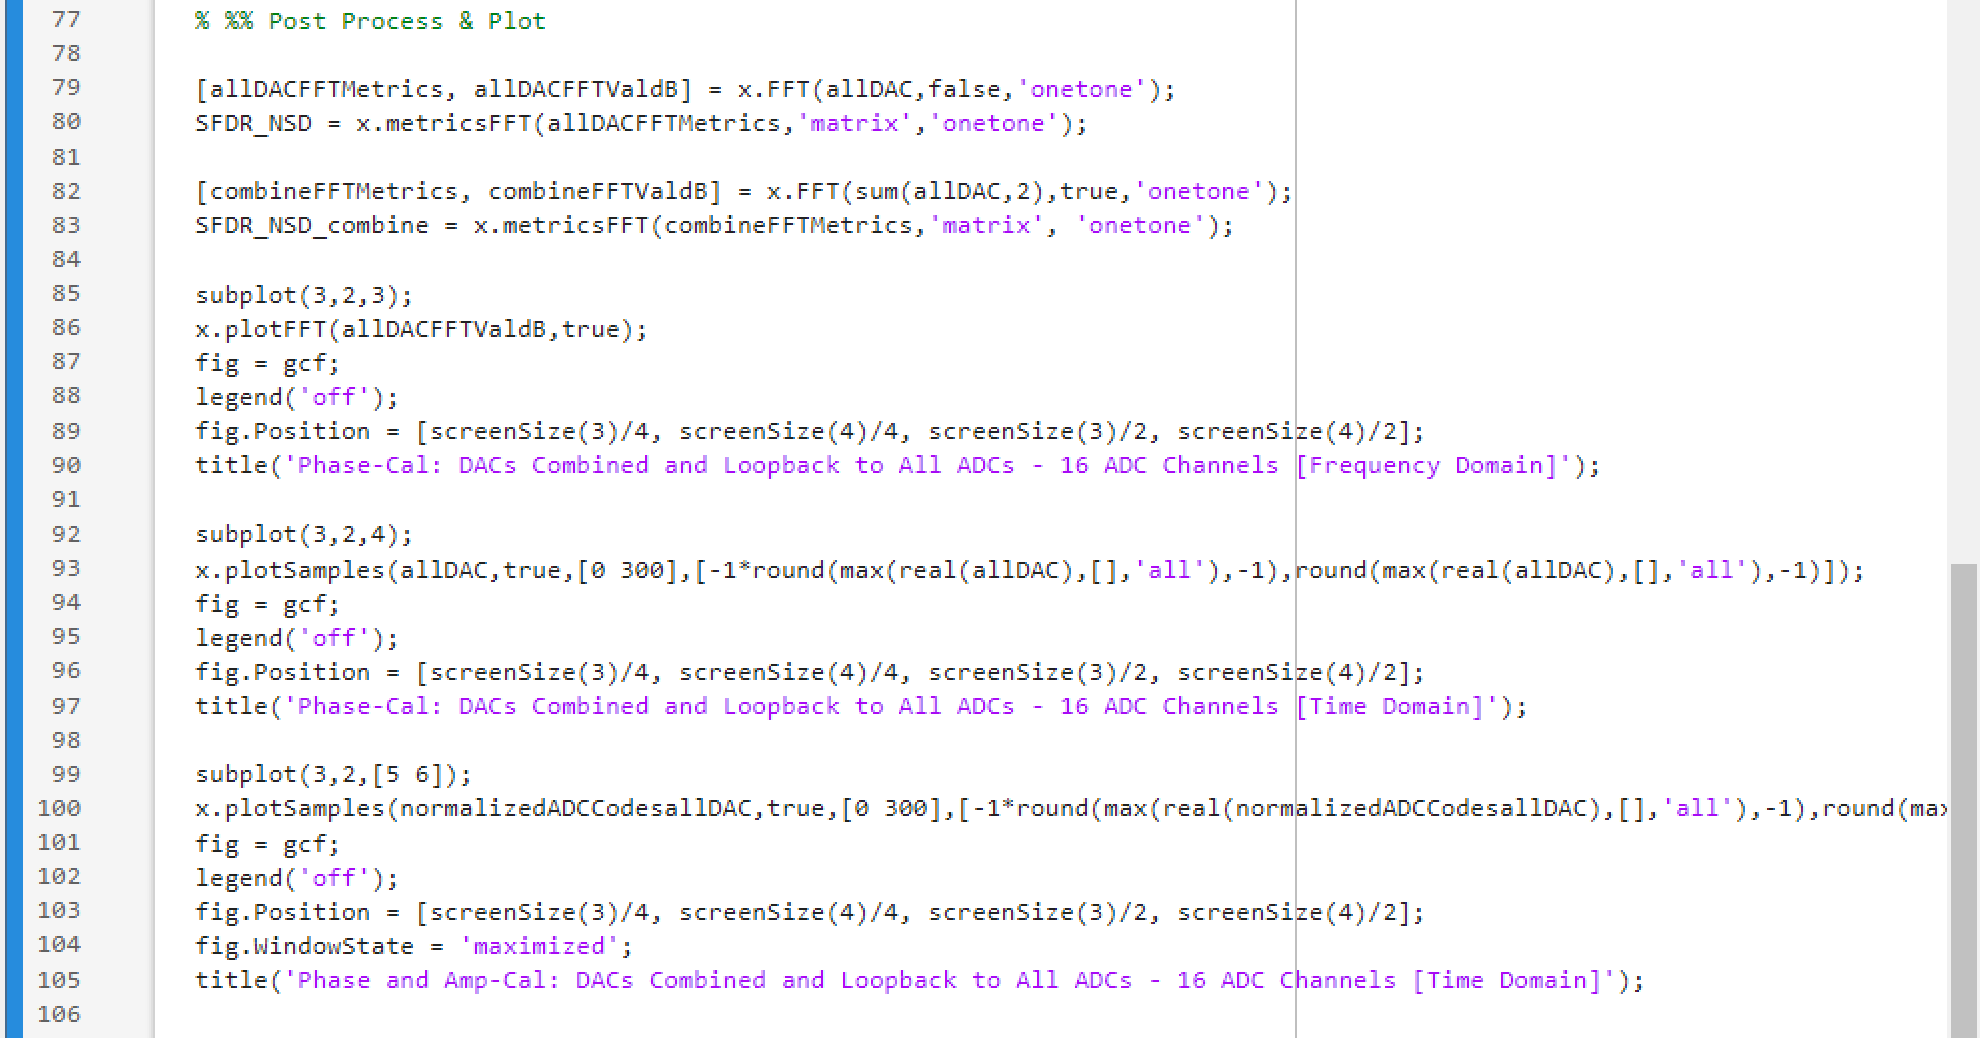
Step 8: Final plotting of post calibration data
In lines 79 through 105, we will then replot the post calibration results and present a summary plot to the user
Note
If the summary plot below is obtained, the system is setup correctly: the software installation on the control PC is working as expected and the hardware and firmware on the Triton Platform is operating as expected.