Evaluating the AD7405 with the SDP-H1
Features
Full featured evaluation board for the AD7405
On-board power supply
Standalone capability
System demonstration platform (SDP-H1) compatible (EVAL-SDP-CH1Z)
PC software for control and data analysis
Evaluation Kit Contents
EVAL-AD7405FMCZ evaluation board
CD containing evaluation software for the AD7405
Equipment Needed
SDP-H1 (EVAL-SDP-CH1Z) system demonstration platform
Signal source
PC running Windows XP SP3, Windows Vista, or Windows 7 with USB 2.0 port
Software Requirement
AD7405 evaluation software (included on CD)
General Description
The EVAL-AD7405FMCZ is a full featured evaluation board designed to allow the user to easily evaluate all features of the AD7405 isolated analog-to-digital converter (ADC). The evaluation board can be controlled by the EVAL-SDP-CH1Z via the FMCZ connector (J9). The SDP-H1 board (EVAL-SDP-CH1Z) allows the evaluation board to be controlled through a USB port of a PC using the evaluation board software available for download from the product page or from the included installer CD included in the evaluation board kit.
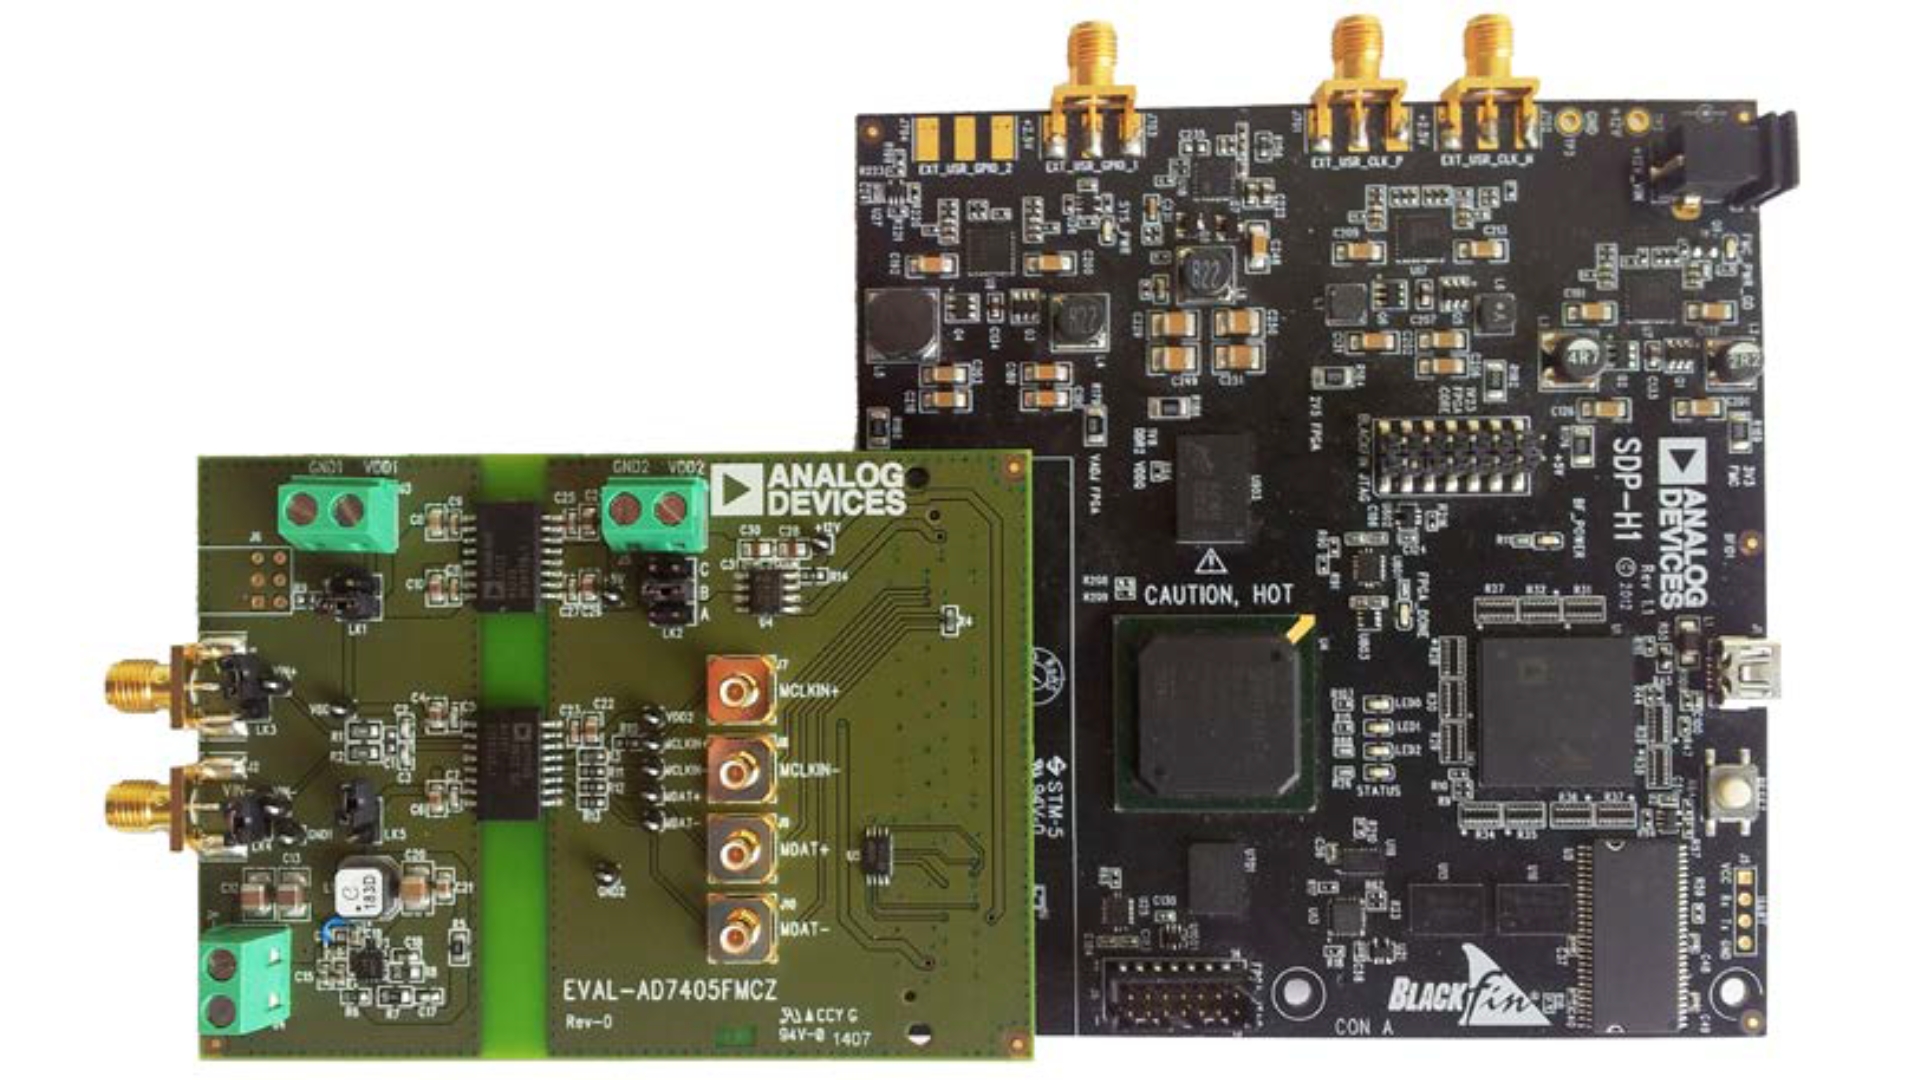
Evaluation Board Photograph
Quick Start Guide
To begin using the evaluation board, take the following steps:
Install the evaluation software from the AD7405 product page or from the included CD. Ensure that the EVAL-SDP-CH1Z board is disconnected from the USB port of the PC while installing the software. (The PC may need to be restarted after the installation.)
Ensure that the various link options are configured as outlined in Table 1.
Connect the EVAL-SDP-CH1Z board to the evaluation board as shown in Figure 1.
Connect the EVAL-SDP-CH1Z board to the PC via the USB cable. For Windows® XP, you may need to search for the EVAL-SDP-CH1Z drivers. Choose to automatically search for the drivers for the EVAL-SDP-CH1Z board if prompted by the operating system.
Power up the EVAL-SDP-CH1Z by inserting the 12 V dc barrel jack (included with EVAL-SDP-CH1Z), into the barrel connector labeled +12V_VIN on the EVAL-SDP-CH1Z.
Launch the evaluation software from the Analog Devices subfolder in the Programs menu.
Connect an input signal via the VIN+, J1 connector.
Design Overview
Evaluation Board Hardware
Hardware Link Options
Table 1. Link Options
Category |
Link |
Default Position |
Function |
|---|---|---|---|
Power Supplies |
LK1 |
A |
This link selects the AD7405 VDD1 supply source. Remove LK5 if using either Position A or Position B. Position A: VDD1 is supplied from the ADuM6000 on-board device. Position B: VDD1 is supplied externally via Connector J3. |
Power Supplies |
LK5 |
Removed |
When LK5 is inserted, VDD1 is supplied via a step-down dc-to-dc regulator via J4. Remove LK5 if VDD1 is supplied via LK1. Remove LK1 if VDD1 is supplied via LK5. |
Power Supplies |
LK2 |
A |
This link selects the AD7405 VDD2 supply source. Position A: VDD2 is supplied from the EVAL-SDP-CH1Z board. Position B: VDD2 is supplied from the on-board 5 V regulator. Position C: VDD2 is supplied externally via Connector J5. |
Analog Input |
LK7 |
Removed |
When LK7 is inserted, VIN+ is shorted to ground. Remove LK7 if a signal is applied to AIN+. |
Analog Input |
LK8 |
Inserted |
When LK8 is inserted, VIN− is shorted to ground. Remove LK8 if a signal is applied to AIN−. |
On-Board Connectors
Table 2 provides information about the external on-board connectors on the EVAL-AD7405FMCZ evaluation board.
Table 2. On-Board Connectors
Connector |
Function |
|---|---|
J1 |
Analog input AIN+ |
J2 |
Analog input AIN− |
J3 |
MCLK input — standalone mode |
J4 |
MDAT output — standalone mode |
J5 |
VDD1 external source |
J6 |
VDD2 external source |
J7 |
VDD1 external source — high voltage |
Power Supply
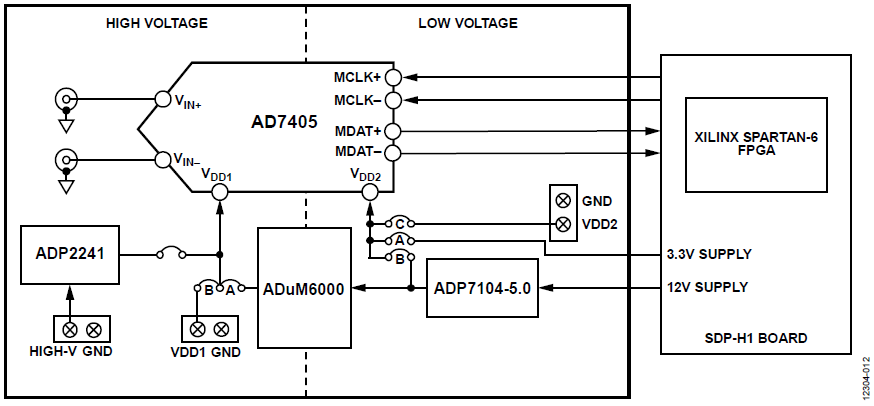
This evaluation board is designed to be supplied via the EVAL-SDP-CH1Z. The EVAL-SDP-CH1Z generates 12 V and 3.3 V supply rails. The 12 V supply is connected to the on-board 5 V linear regulator that supplies the ADuM6000 with power. The ADuM6000 then generates an isolated 5 V supply to power the VDD1 rail of the AD7405. The 3.3 V supply rail from the EVAL-SDP-CH1Z is used to supply the VDD2 rail of the AD7405.
If the user wishes to supply VDD1 externally, an external power supply in the range of 24 V ± 5% may be connected to the HIGH_V connector, J4. Alternatively an external supply in the range of 5 V ± 10% may be connected to the J3 connector.
The VDD2 supply may also be supplied via an external power supply in the range of 3 V to 5.5 V via the J5 connector.
There are two main ground planes, GND1 and GND2. These are isolated planes with a creepage and clearance of 8 mm.
Caution
When the EVAL-AD7405FMCZ is connected to the EVAL-SDP-CH1Z, take care to ensure that if an external voltage is supplied to the J5 input connector, the voltage does not exceed 3.3 V. Exceeding this voltage may cause permanent damage to the EVAL-SDP-CH1Z board.
Evaluation Board Software
Software Installation Procedures
The EVAL-AD7405FMCZ evaluation kit includes a CD containing evaluation software to be installed on your PC before you begin using the evaluation board.
There are two parts to the installation:
EVAL-AD7405FMCZ evaluation software installation
EVAL-SDP-CH1Z system demonstration platform board driver installation
Warning
The evaluation board software and drivers must be installed before connecting the evaluation board and EVAL-SDP-CH1Z board to the USB port of the PC to ensure that the evaluation system is correctly recognized when it is connected to the PC.
Installing the EVAL-AD7405FMCZ Evaluation Software
To install the EVAL-AD7405FMCZ evaluation software, take the following steps:
Insert the included evaluation software installation CD into the CD drive of a Windows-based PC, and open the contents of the CD.
Double-click the setup.exe file to begin the installation. By default, the software is saved to the following location: C:\Program Files\Analog Devices\AD740X
A dialog box appears asking for permission to allow the program to make changes to your computer. Click Yes to begin the installation process (see Figure 3).
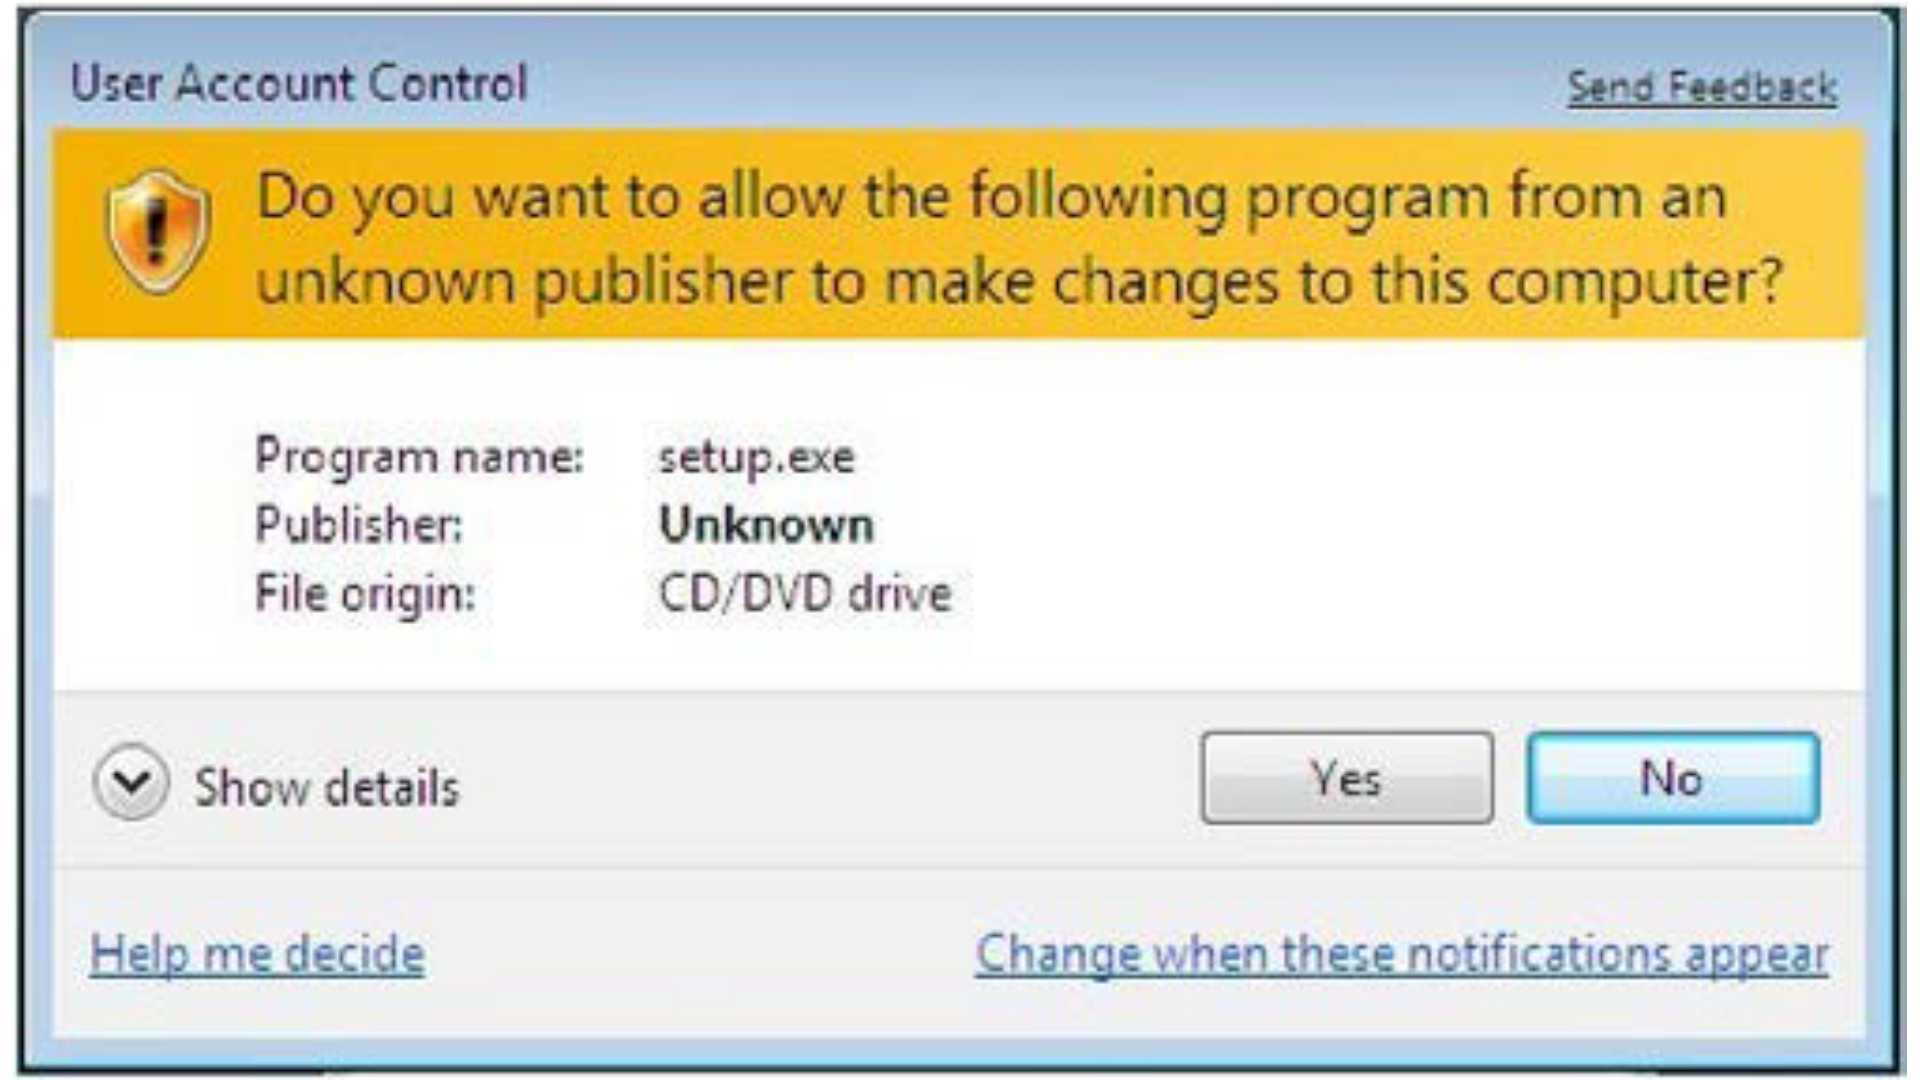
Figure 3 Evaluation Software Installation—User Account Control
Select the location to install the software, and then click Next (see Figure 4).
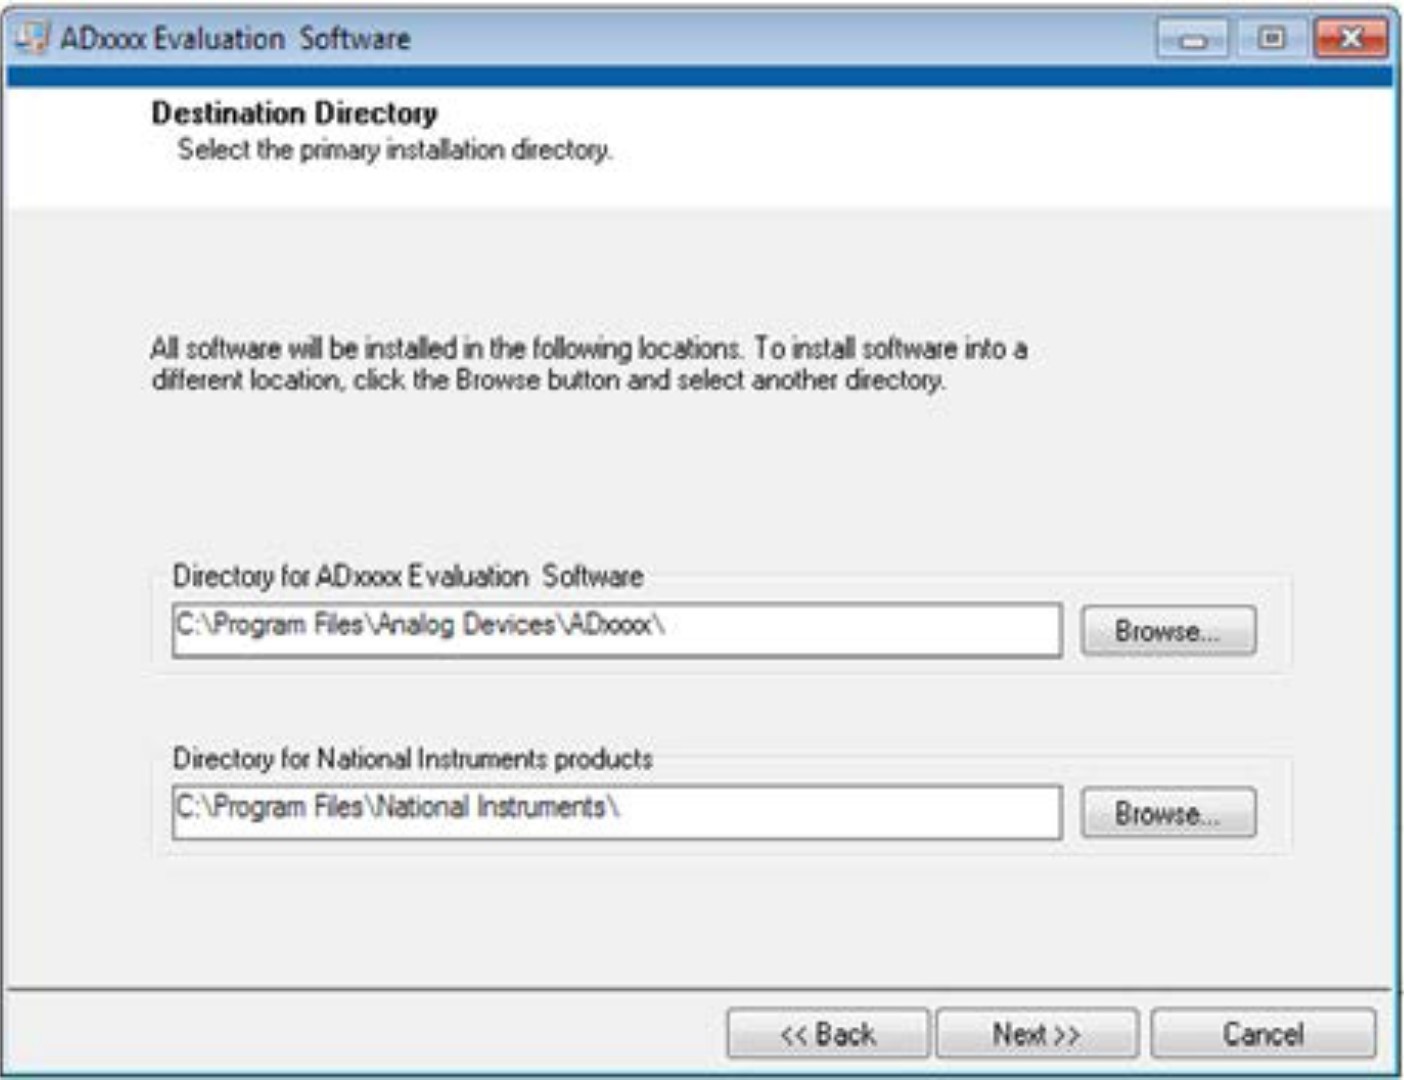
Figure 4 Evaluation Software Installation—Destination Directory
A license agreement appears. Read the agreement and then select I accept the License Agreement and click Next.
A summary of the installation is displayed. Click Next to continue (see Figure 5).
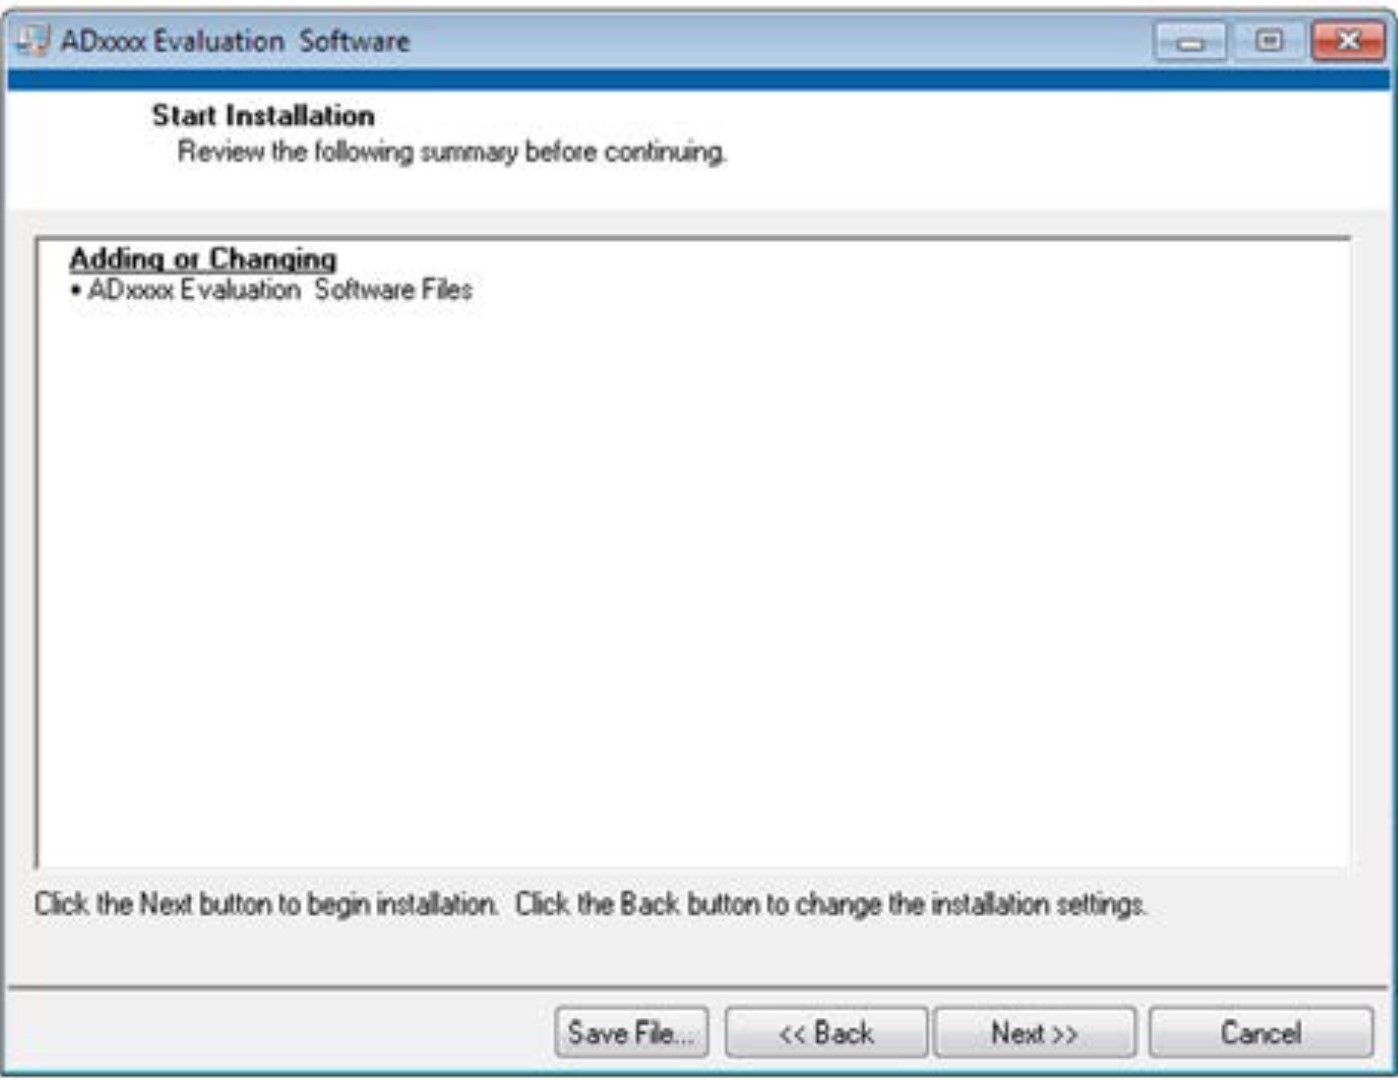
Figure 5 Evaluation Software Installation—Start Installation
A dialog box informs you when the evaluation software installation is complete. Click Next to proceed with the installation of the drivers (see Figure 6).
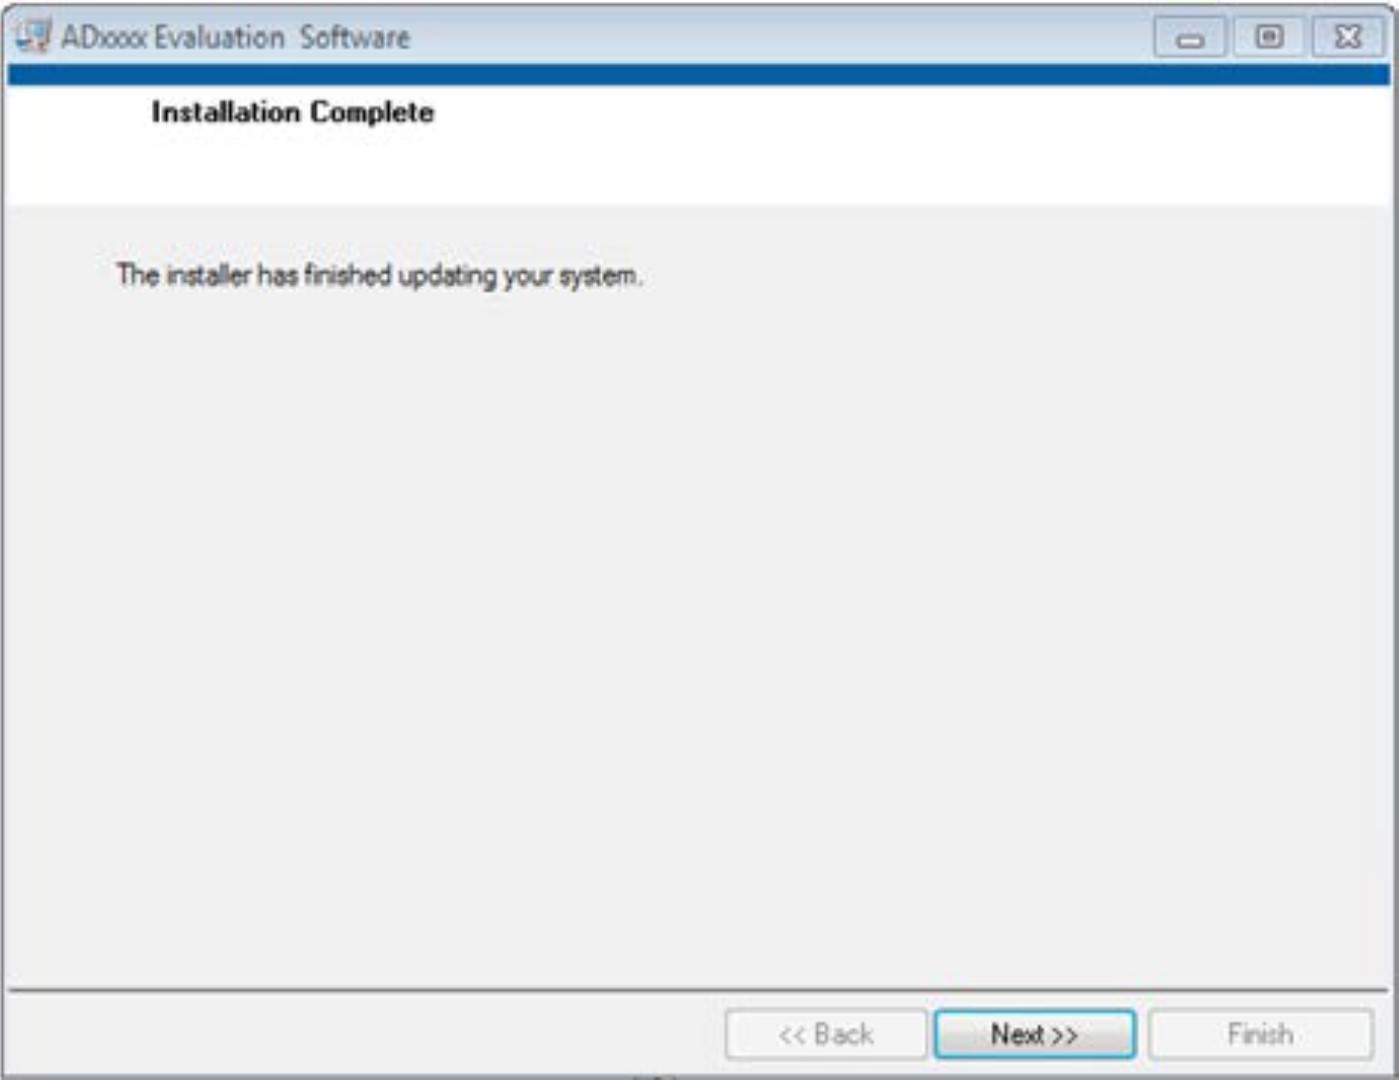
Figure 6 Evaluation Software Installation—Installation complete
Installing the EVAL-SDP-CH1Z System Demonstration Platform Board Drivers
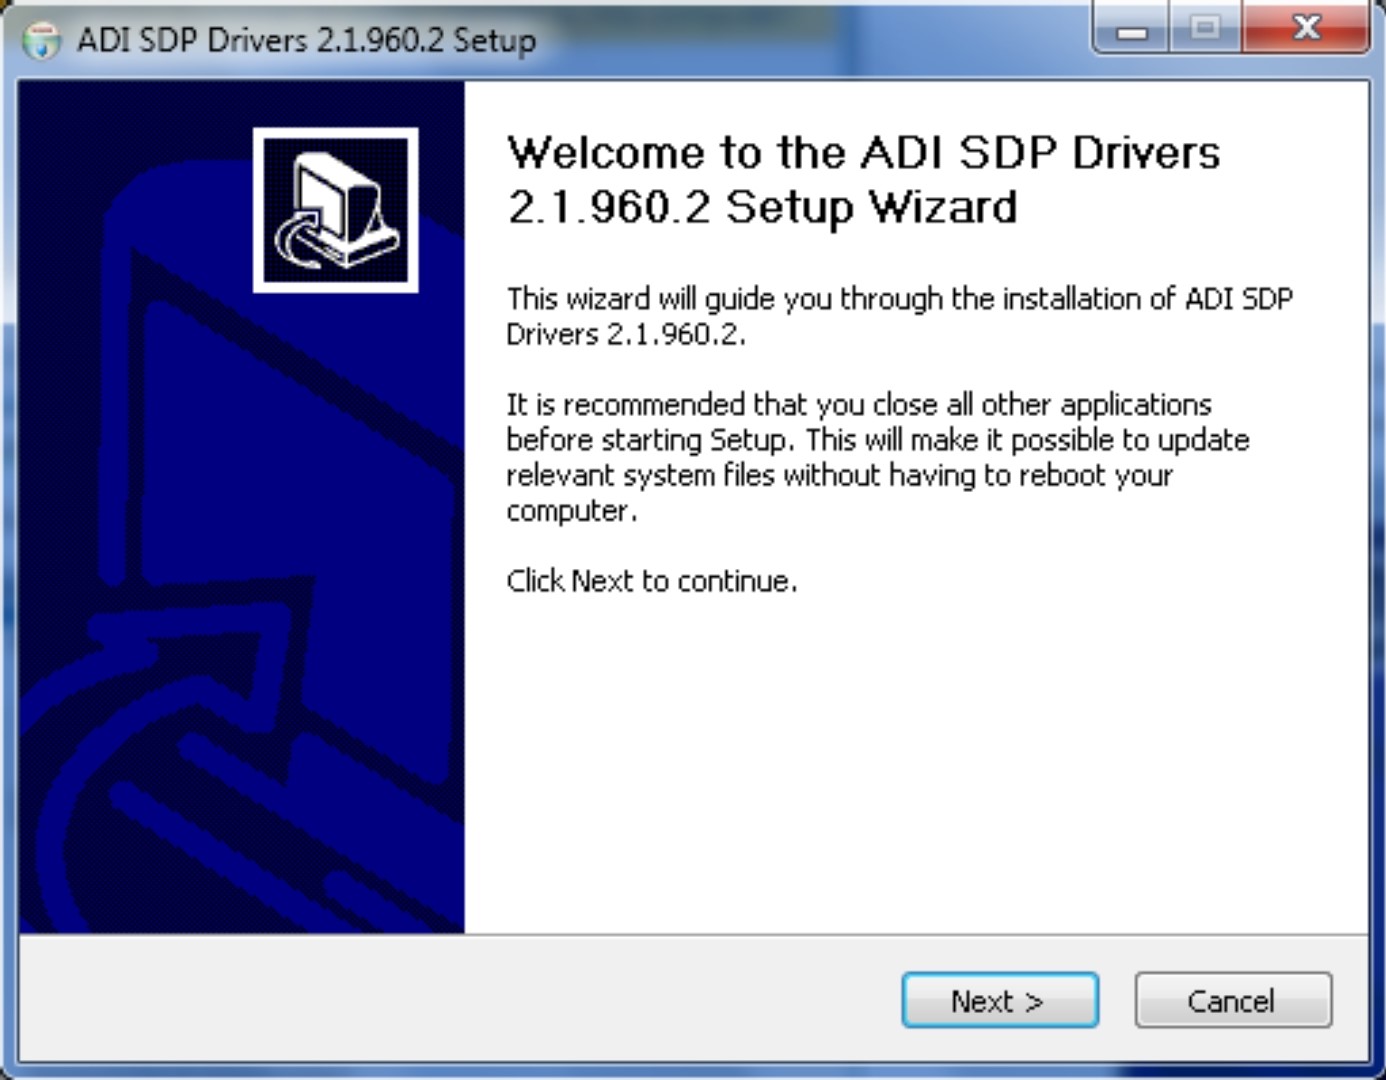
After the installation of the evaluation board software is complete, the ADI SDP Drivers Setup Wizard window opens for the installation of the EVAL-SDP-CH1Z system demonstration platform board drivers (see Figure 7).
Make sure that all other applications are closed, and then click Next to begin the driver installation process (see Figure 7).
Select the location to install the drivers, and then click Install (see Figure 8).
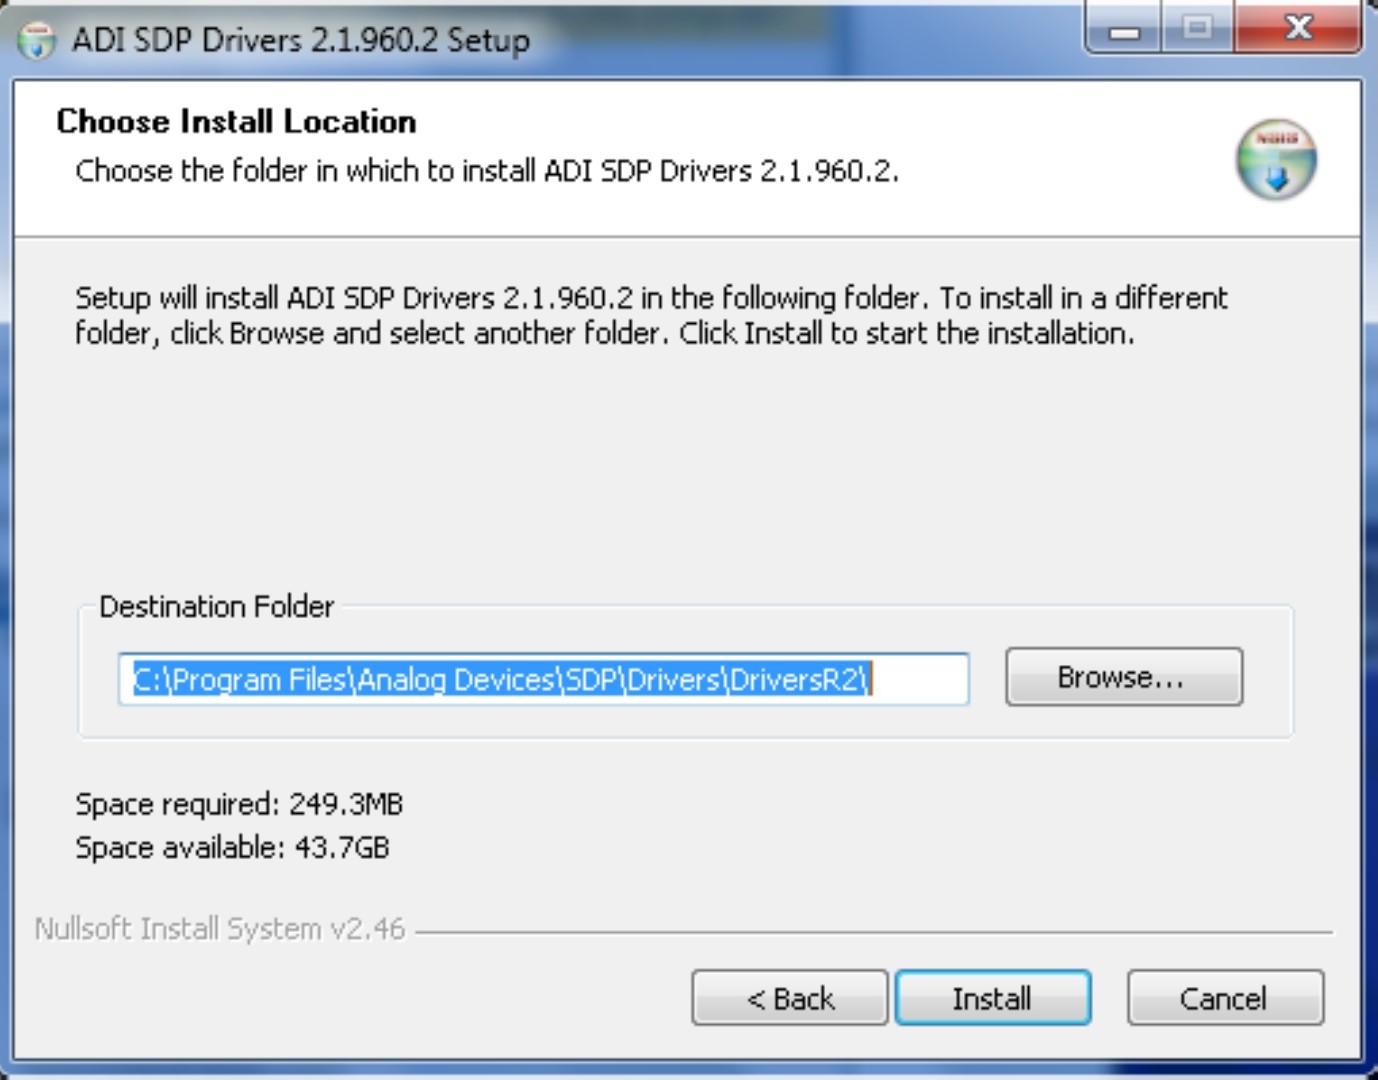
Figure 8 EVAL-SDP-CH1Z Drivers Installation—Choose Install Location
Click Install to proceed with the installation (see Figure 9).

Figure 9 EVAL-SDP-CH1Z Drivers Installation—Windows Security
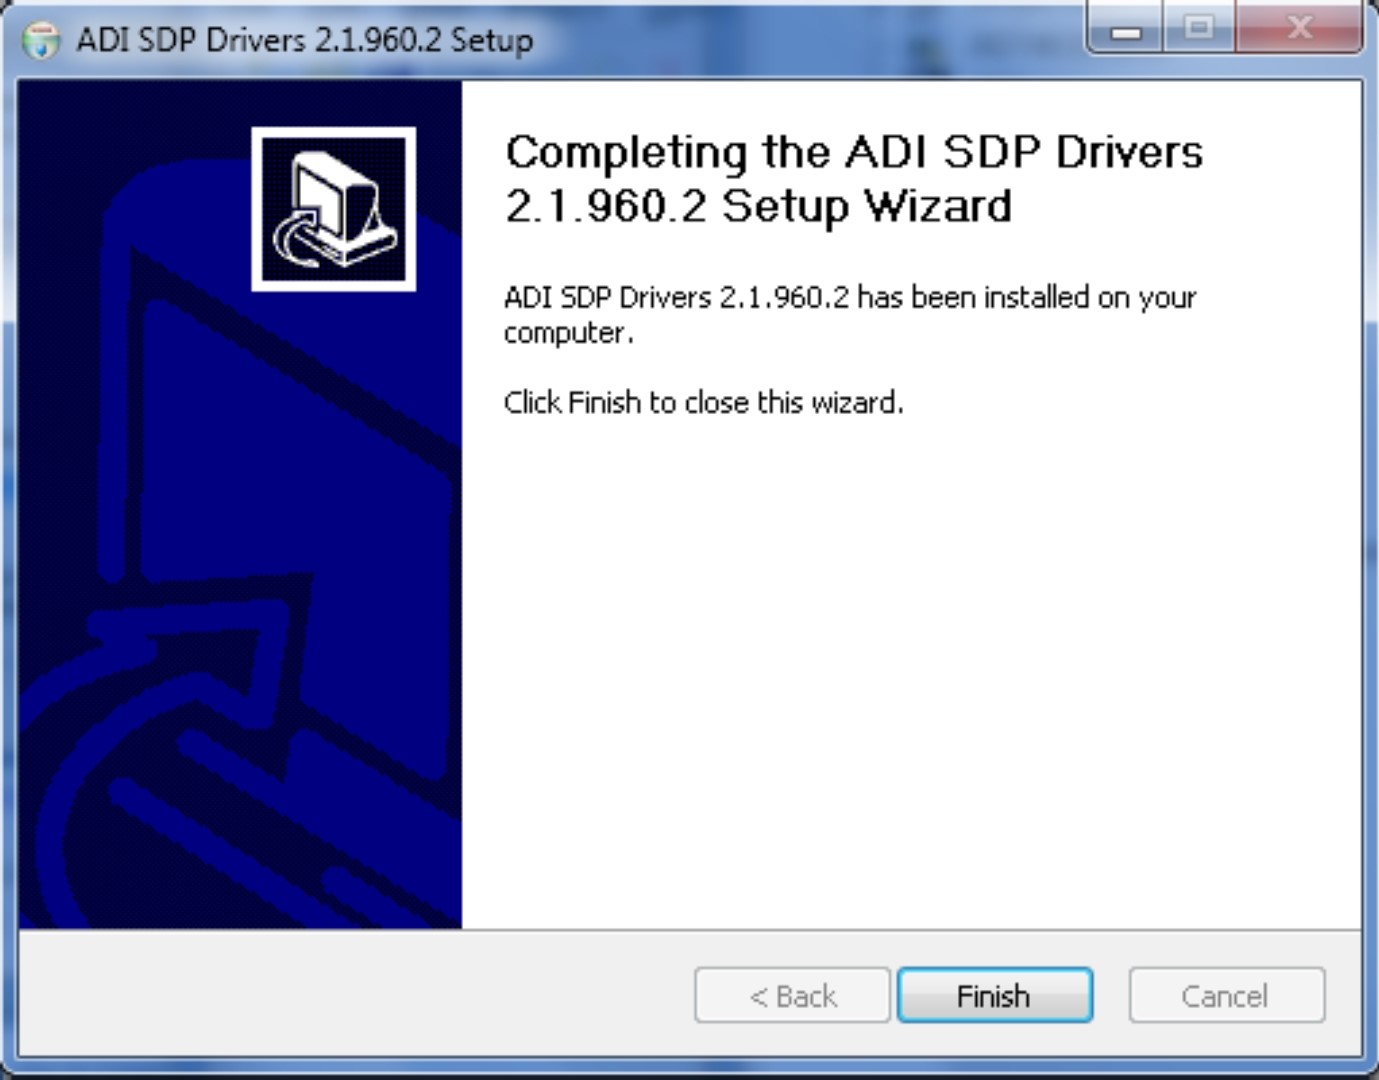
To complete the drivers installation, click Finish, which closes the installation wizard (see Figure 10).
Evaluation Board Setup Procedures
The EVAL-AD7405FMCZ connects to the EVAL-SDP-CH1Z system demonstration platform. The EVAL-SDP-CH1Z board is the controller board, which is the communication link between the PC and the main evaluation board. Figure 1 shows a photograph of the connections between the EVAL-AD7405FMCZ daughter board and the EVAL-SDP-CH1Z board.
After following the instructions in the Software Installation Procedures section, set up the evaluation and SDP-H1 boards as detailed in this section.
Warning
The evaluation board software and drivers must be installed before connecting the evaluation board and EVAL-SDP-CH1Z board to the USB port of the PC to ensure that the evaluation system is correctly recognized when it is connected to the PC.
Connecting the Evaluation and SDP Boards to a PC
Ensure that all configuration links are in the appropriate positions (see Table 1).
Connect the EVAL-AD7405FMCZ board securely to the J4 FMC connector on the EVAL-SDP-CH1Z board.
The EVAL-SDP-CH1Z board requires an external power supply adapter, which is included in the EVAL-SDP-CH1Z kit. Connect this power supply to the dc barrel connector labeled +12V_VIN on the EVAL-SDP-CH1Z board.
Connect the EVAL-SDP-CH1Z board to the PC via the USB cable enclosed in the EVAL-SDP-CH1Z kit.
Verifying the Board Connection
Allow the Found New Hardware Wizard to run after the EVAL-SDP-CH1Z board is plugged into your PC. (If you are using Windows XP, you may need to search for the EVAL-SDP-CH1Z drivers. Choose to automatically search for the drivers for the EVAL-SDP-CH1Z board if prompted by the operating system.)
Check that the board is connected to the PC correctly using the Device Manager of the PC.
Access the Device Manager as follows:
Right-click My Computer and then click Manage.
A dialog box appears asking for permission to allow the program to make changes to your computer. Click Yes.
The Computer Management box appears. From the list of System Tools, click Device Manager.
Under ADI Development Tools, Analog Devices SDP-H1 should appear (see Figure 11), indicating that the EVAL-SDP-CH1Z driver software is installed and that the board is connected to the PC correctly.
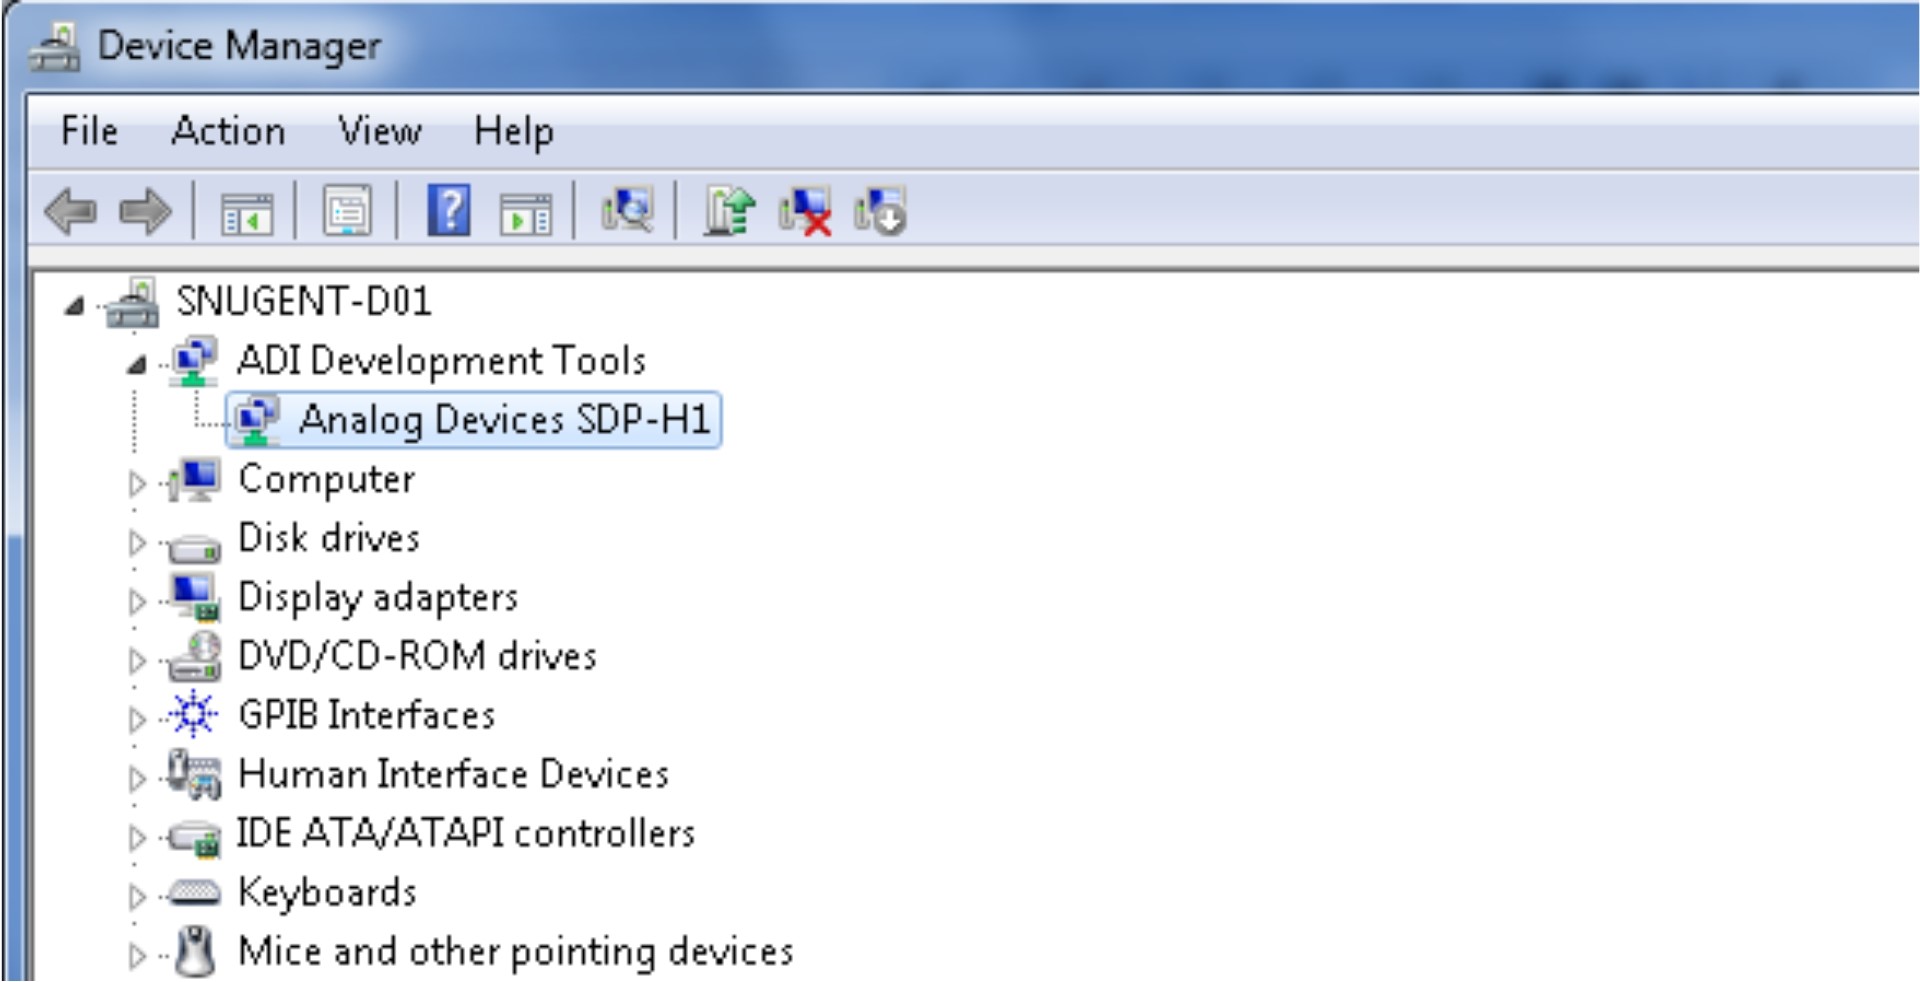
Figure 11 Device Manager: Checking That the Board Is Connected to the PC Correctly
Disconnecting the EVAL-AD7405FMCZ Board
Caution
To avoid damage to the board, always power down the EVAL-SDP-CH1Z board before disconnecting the EVAL-AD7405FMCZ board from the EVAL-SDP-CH1Z board.
Starting the Software
After the EVAL-AD7405FMCZ and EVAL-SDP-CH1Z boards are correctly connected to your PC, the evaluation software can be started.
From the Start menu, select Programs > Analog Devices > AD7405. The main window of the software then opens (see Figure 13).
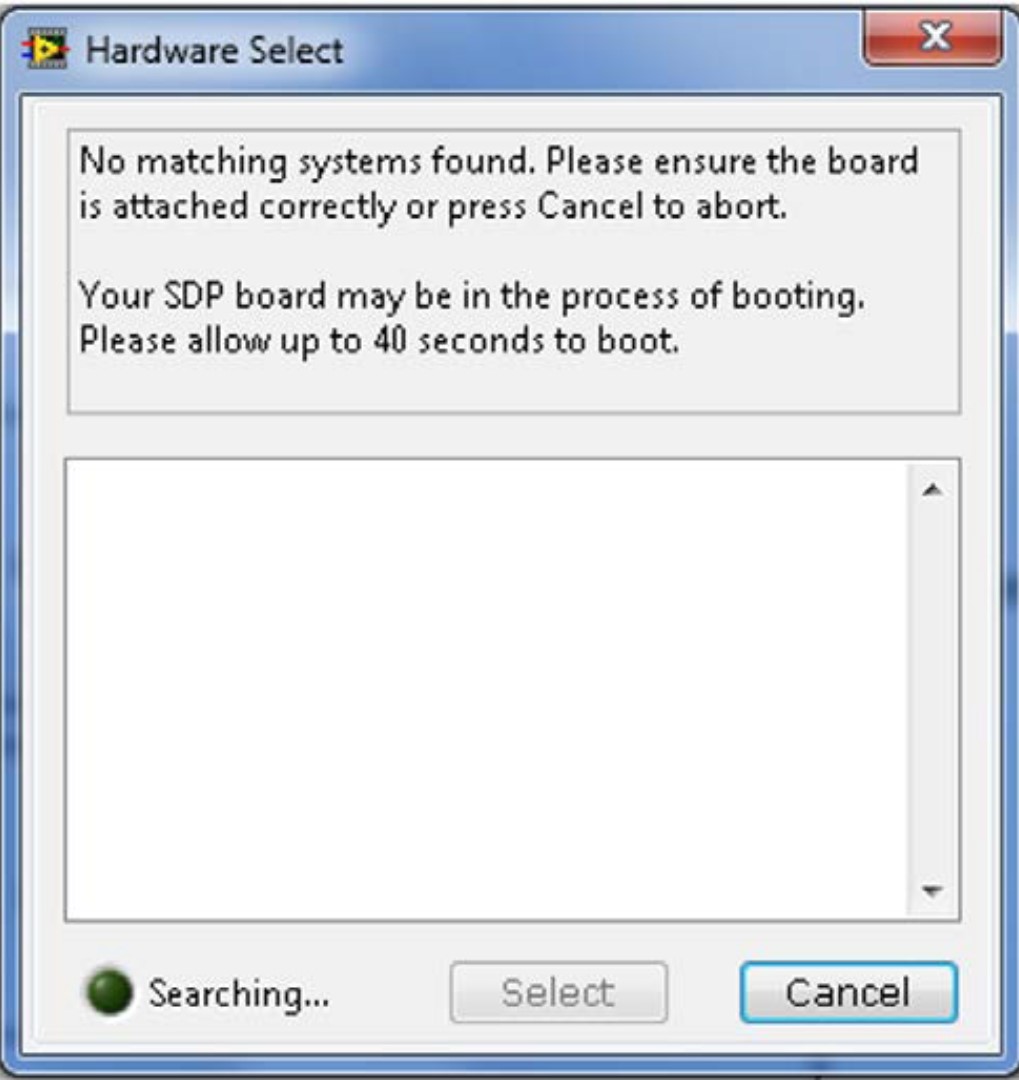
If the EVAL-AD7405FMCZ is not connected to the USB port via the EVAL-SDP-CH1Z when the software is launched, a connectivity error displays (see Figure 12). Connect the evaluation board to the USB port of the PC, wait a few seconds, click Rescan, and follow the instructions.
Description of Main Window
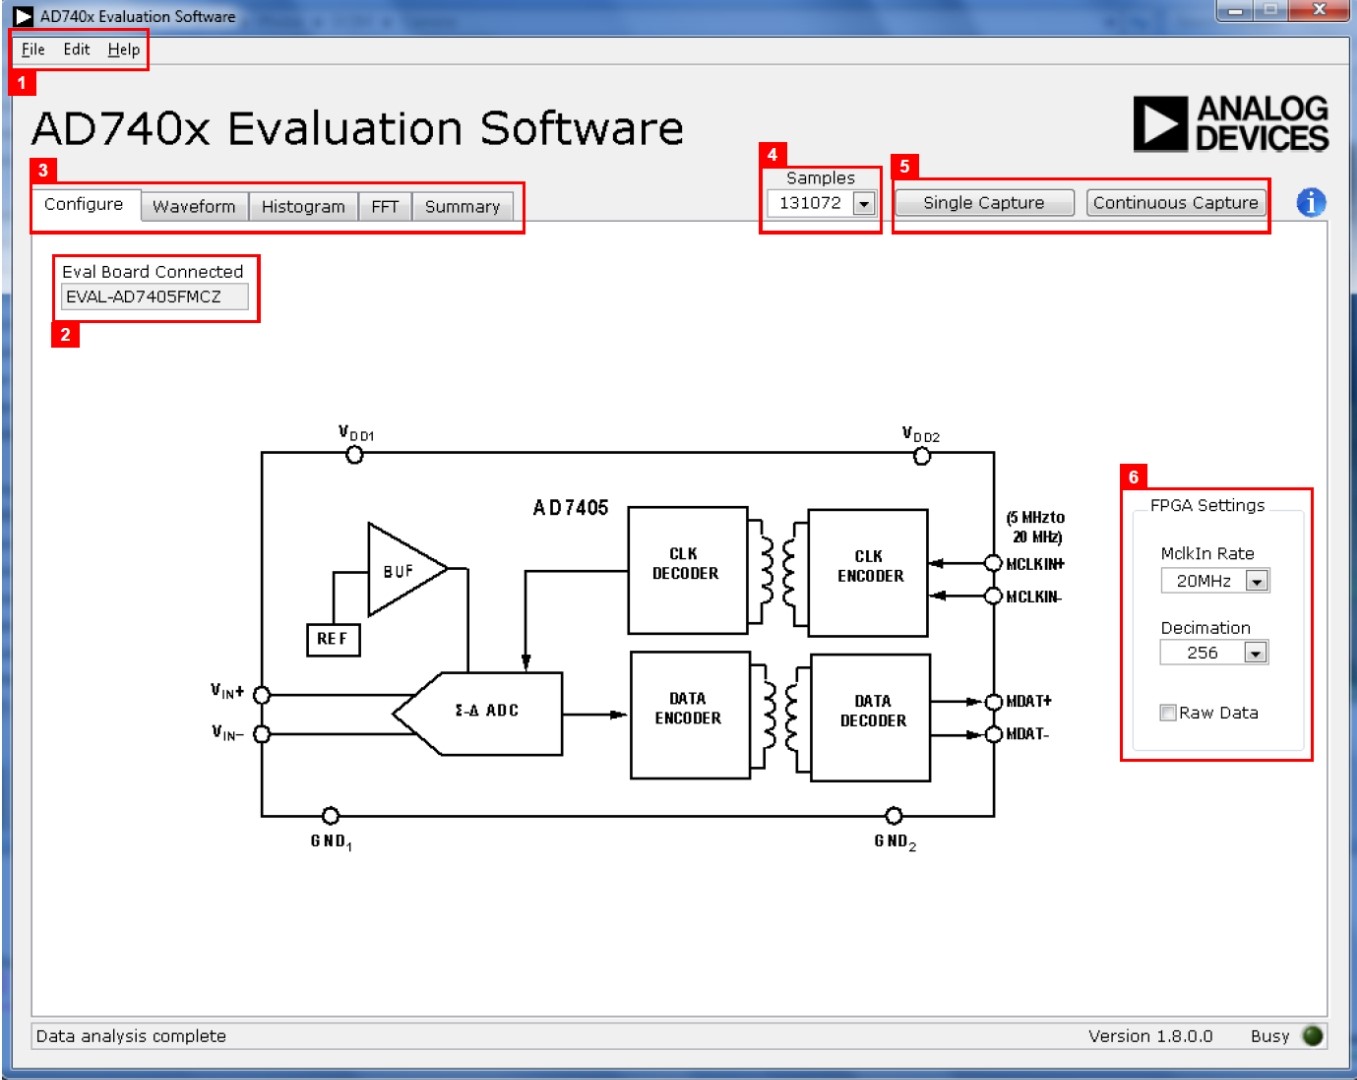
When the software is launched, the main software window opens (see Figure 13). The evaluation software panel as shown in Figure 13 has the following features:
Menu bar
Control buttons
FPGA configuration options
Data capture display
Window Tabs
There are five tabs available in the tabs area (labeled 3 in Figure 14) of the main window: Configure, Waveform, Histogram, FFT, and Summary. These tabs are used to switch among device configuration, waveform analysis, histogram analysis, FFT analysis, and a summary of the last capture. Each tab is described in more detail in the Generating a Waveform Analysis Report; Generating a Histogram of the ADC Code Distribution; Generating a Fast Fourier Transform of AC Characteristics; and Generating a Summary of the Waveform, Histogram, and Fast Fourier Transform sections.
Graph Tools
Graph tools are provided within each tab to allow you to control the cursor, zooming, and panning (see Figure 15) within the graphs displayed.
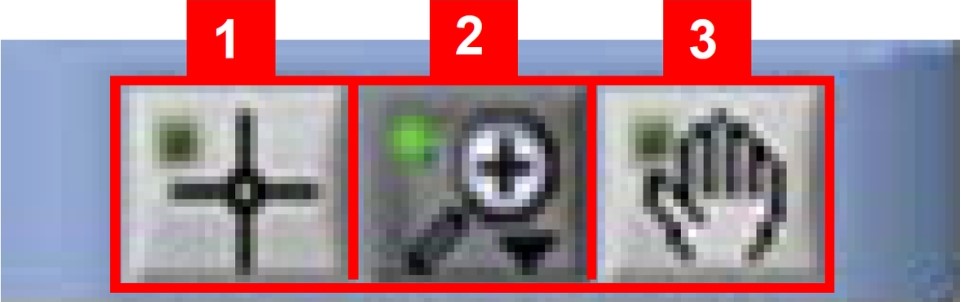
Used for controlling the cursor, if present.
Used for zooming in and out.
Used for panning.
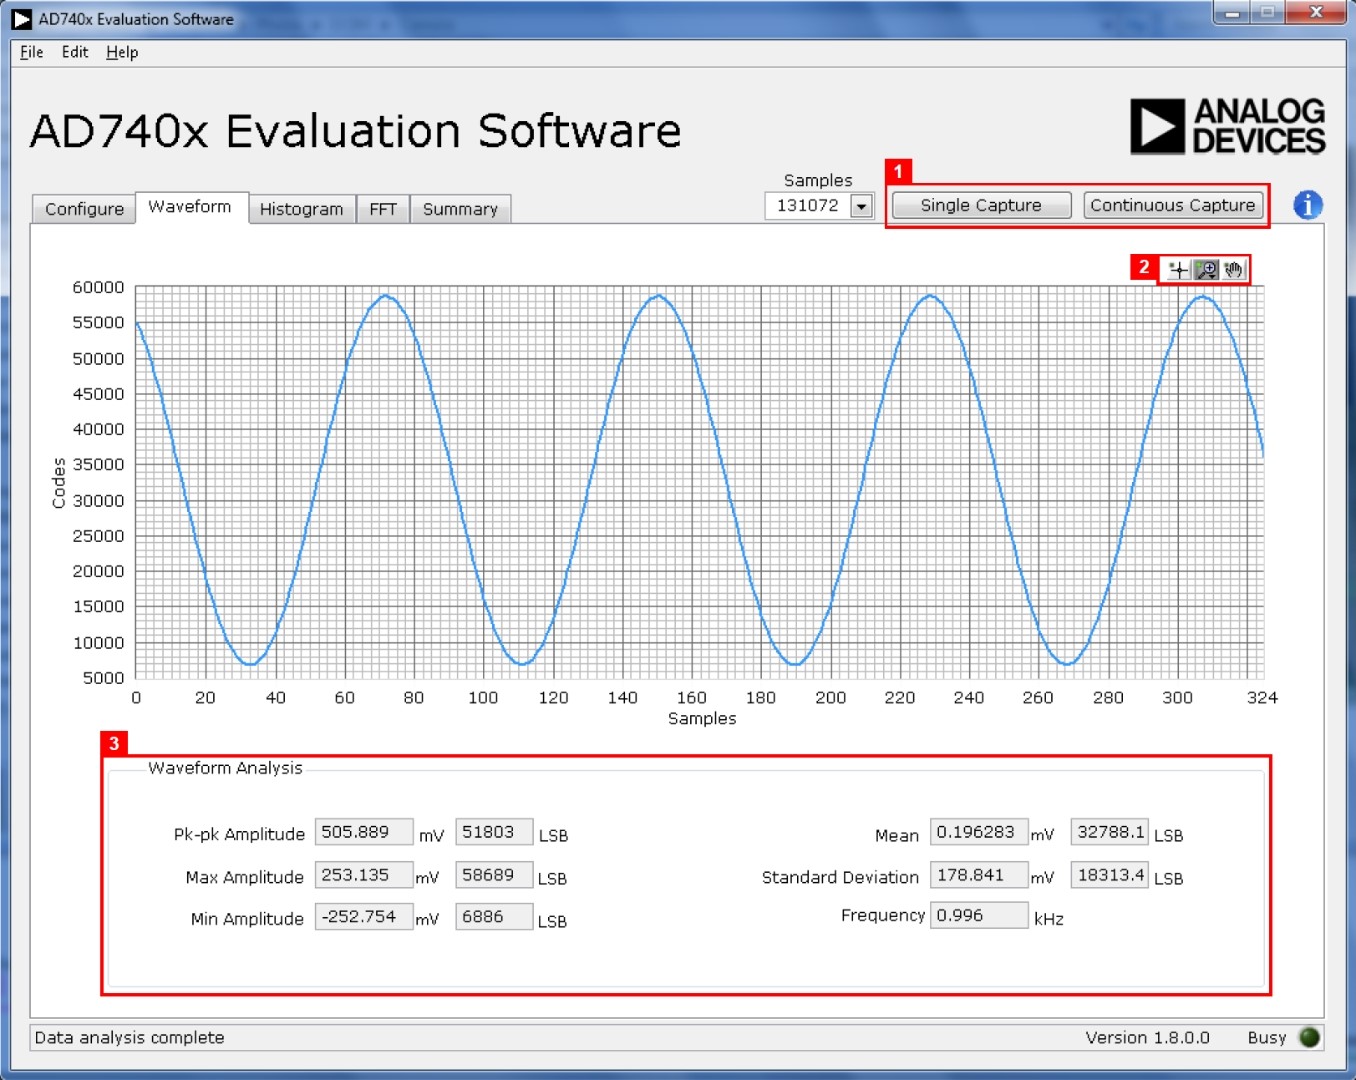
Generating a Waveform Analysis Report
Figure 16 illustrates the tab used for waveform capture.
Click Single Capture or Continuous Capture (labeled 1 in Figure 16) to capture a number of samples from the ADC and graph the resulting waveform.
Graph controls (labeled 2 in Figure 16) are located above the graph and may be used to pan and zoom into particular areas of the graph (see the Graph Tools section and Figure 15 for more information).
The Waveform Analysis area (labeled 3 in Figure 16) shows statistics pertaining to the captured waveform such as maximum, minimum, and mean amplitudes and signal frequency.
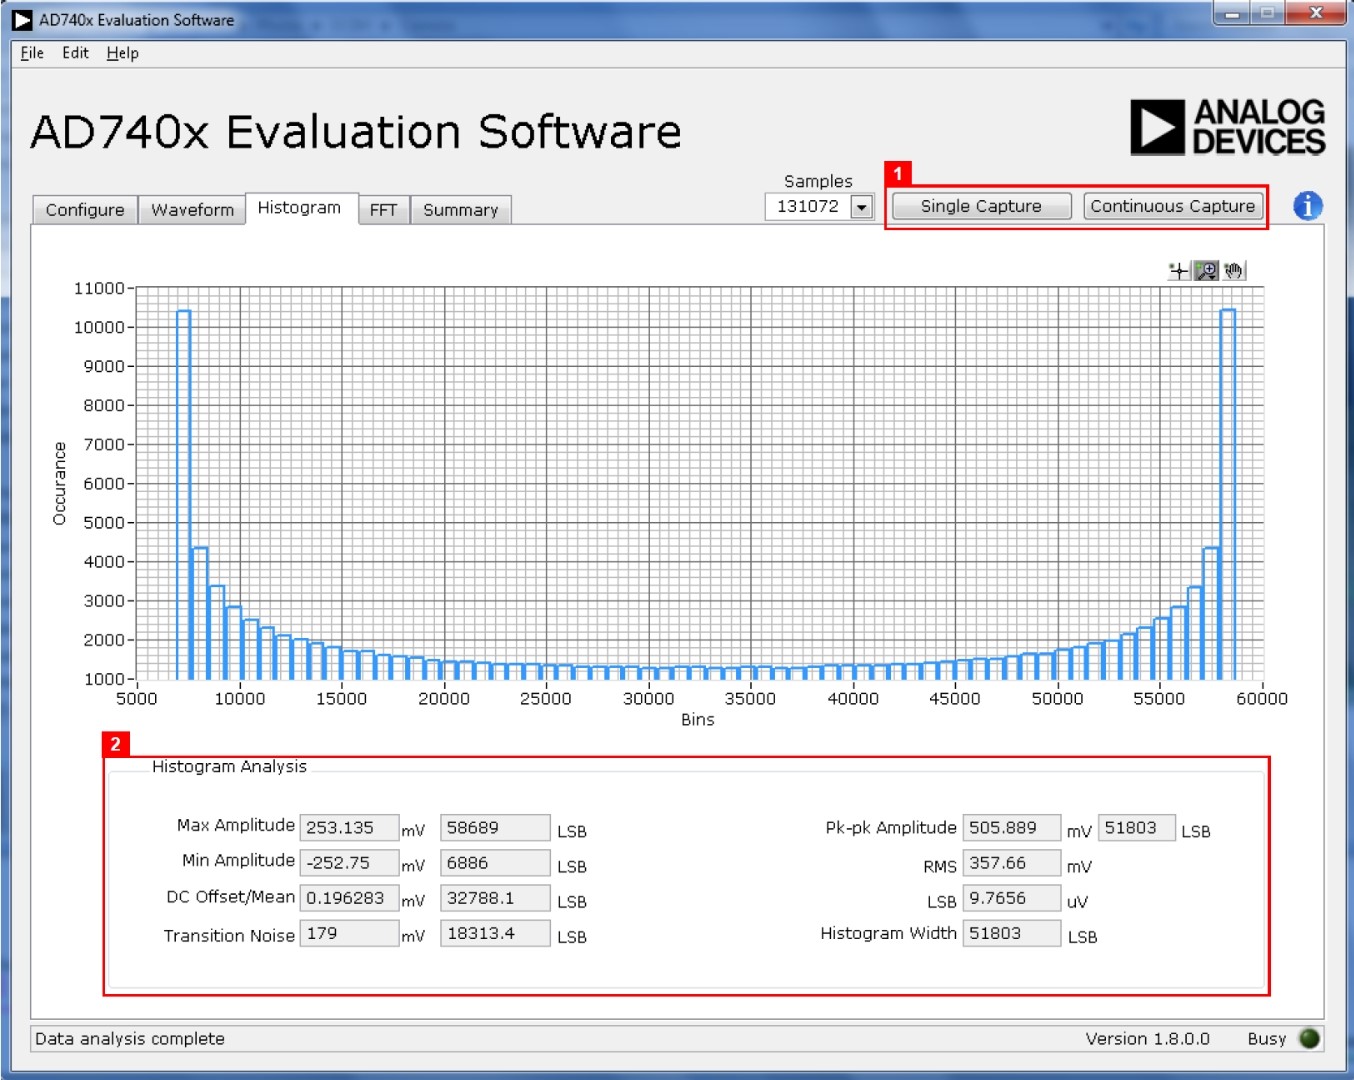
Generating a Histogram of the ADC Code Distribution
The Histogram tab (see Figure 17) can be used to perform ac testing or, more commonly, dc testing. This tab shows the ADC code distribution of the input and computes the mean and standard deviation, which are displayed as DC Offset/Mean and Transition Noise, respectively, in the Histogram Analysis area (labeled 2 in Figure 17).
AC Input
To perform a histogram test of ac input,
Apply a quality signal source to the VIN+ input on the board.
Select the Histogram tab in the evaluation software main window.
Click the Single Capture or Continuous Capture button (labeled 1 in Figure 17).
DC Input
The histogram is more commonly used for dc testing.
To perform a histogram test of dc input,
Select the Histogram tab in the evaluation software main window.
Click Single Capture or Continuous Capture (labeled 1 in Figure 17).
Raw data is captured and passed to the PC for statistical computations, and various measured values are displayed in the Histogram Analysis area (labeled 2 in Figure 17).
Generating a Fast Fourier Transform of AC Characteristics
Figure 18 shows the FFT tab. This feature tests the traditional ac characteristics of the converter and displays a fast Fourier transform (FFT) of the results.
To perform an ac test,
Apply a bipolar sinusoidal signal with low distortion (better than 115 dB) to the evaluation board at the VIN+ input. To attain the requisite low distortion, which is necessary to allow true evaluation of the part, one option is to filter the input signal from the ac source. Choose an appropriate band-pass filter based on the sinusoidal signal applied.
Click the FFT tab from the main window.
Click Single Capture or Continuous Capture.
As in the histogram test, raw data is then captured and passed to the PC, which performs the FFT and displays the resulting SNR, THD, and SINAD.
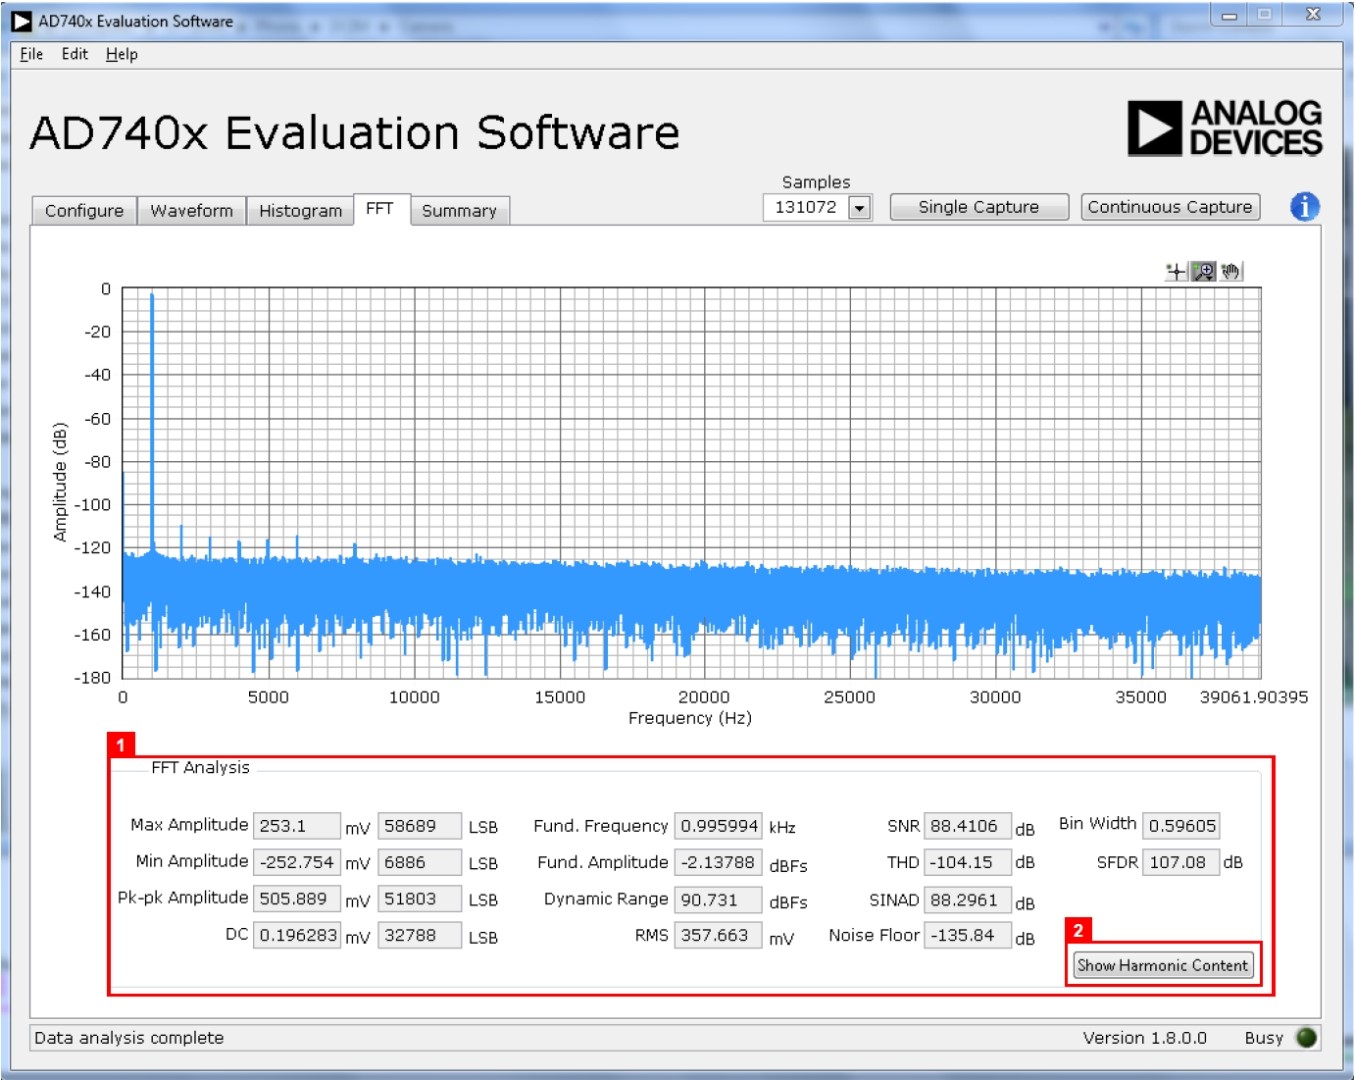
Figure 18 displays the spectral analysis results of the captured data.
The plot is the FFT image of the raw data.
The FFT Analysis box displays the performance data: SNR, THD, SINAD, dynamic range, and noise performance along with the input signal characteristics (see label 1 in Figure 18).
Clicking Show Harmonic Content (labeled 2 in Figure 18) displays the frequency and amplitude of the fundamental in addition to the second to fifth harmonics.
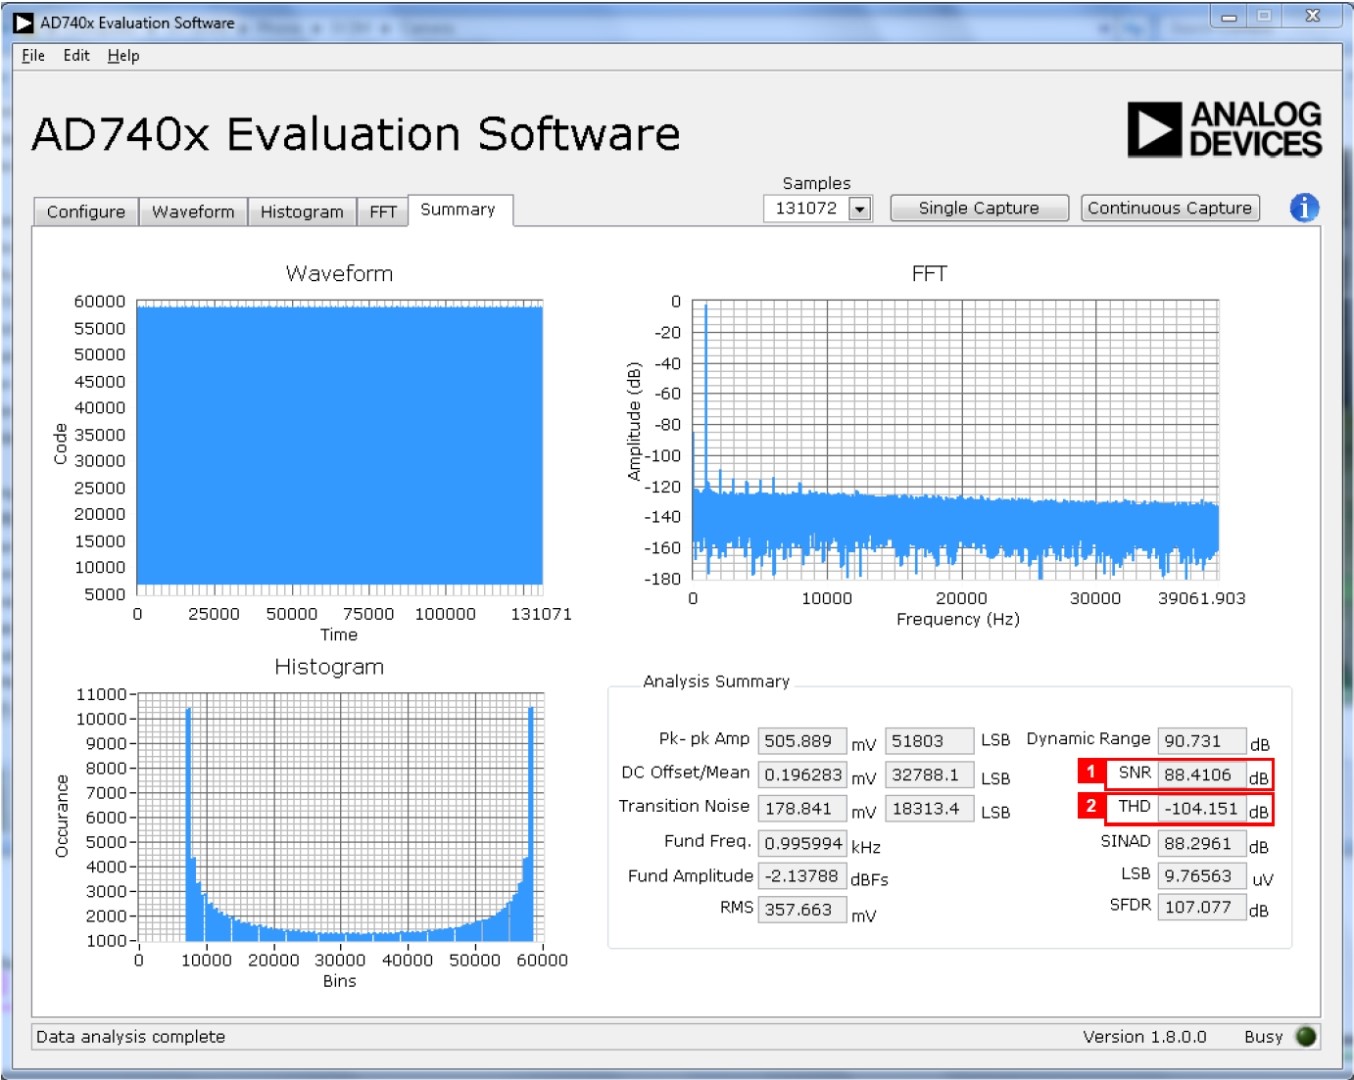
Generating a Summary of the Waveform, Histogram, and Fast Fourier Transform
Figure 19 shows the Summary tab. This tab captures and displays all of the information in one window with a synopsis of the information, including key performance parameters, such as SNR and THD (see the SNR and THD boxes, labeled 1 and 2, respectively, in Figure 19).
Saving Files
The software can save the current captured data for future analysis. The software also has the ability to save or print a screenshot of the currently displayed window.
Saving Captured Data
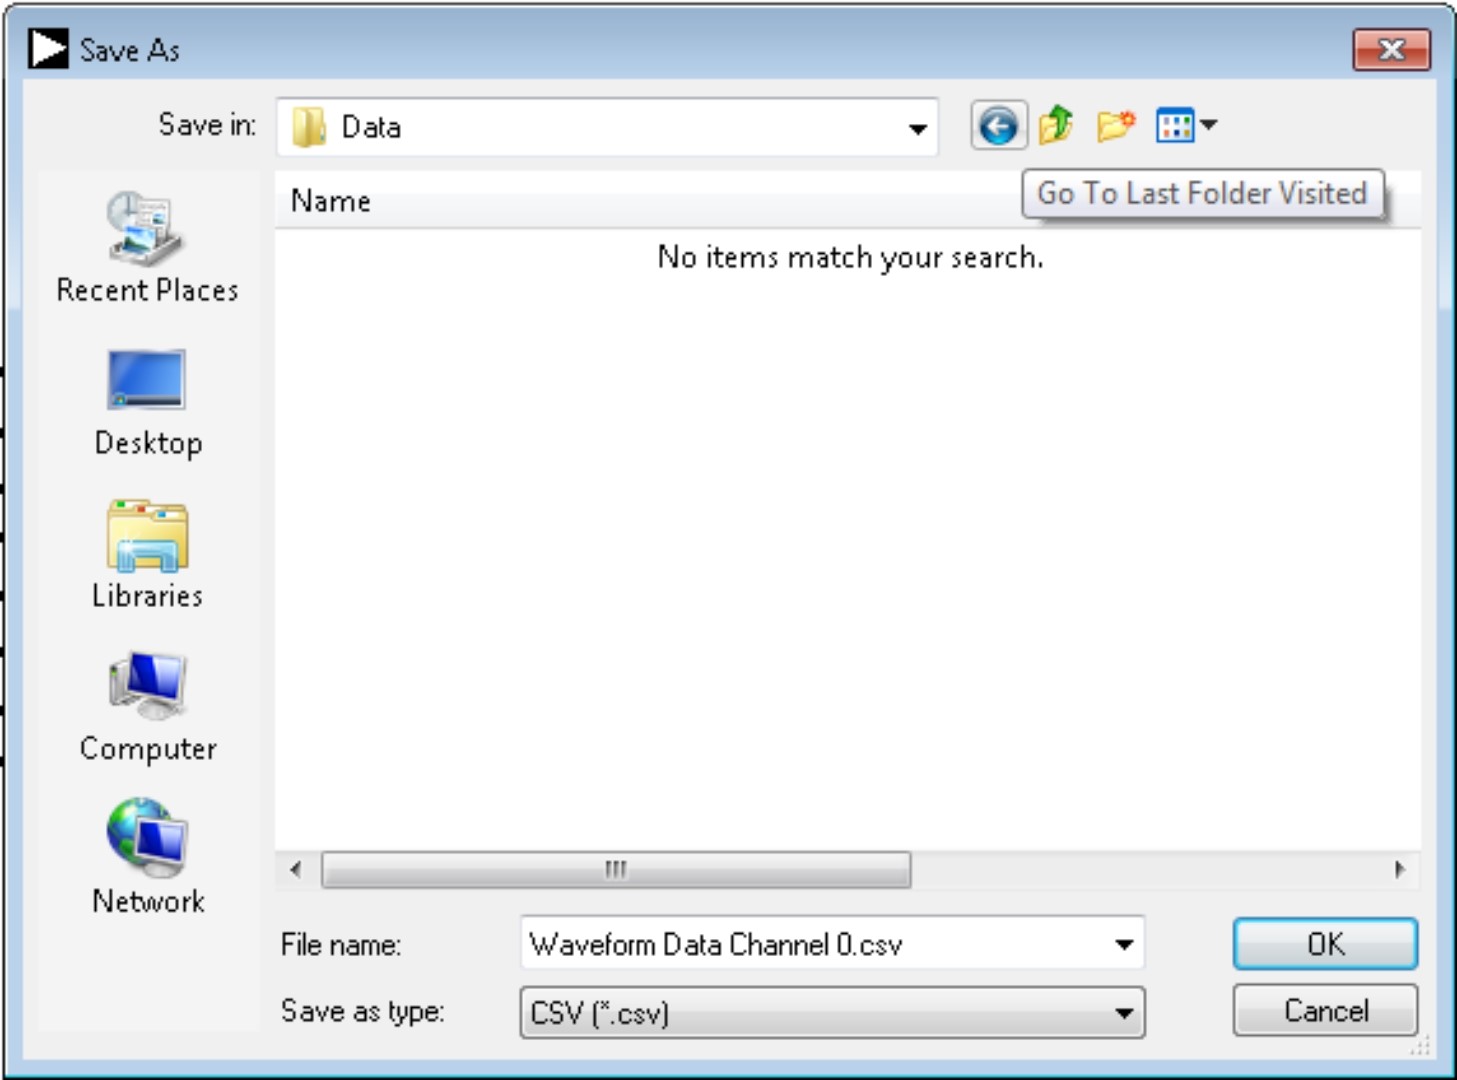
To save data, from the File menu, select Save Captured Data. The Save As dialog box shown in Figure 20 opens. Save the file to an appropriate folder location. Waveform data is saved in .csv format and may be opened for further analysis in other software, such as Excel and MATLAB®.
Saving Screenshot
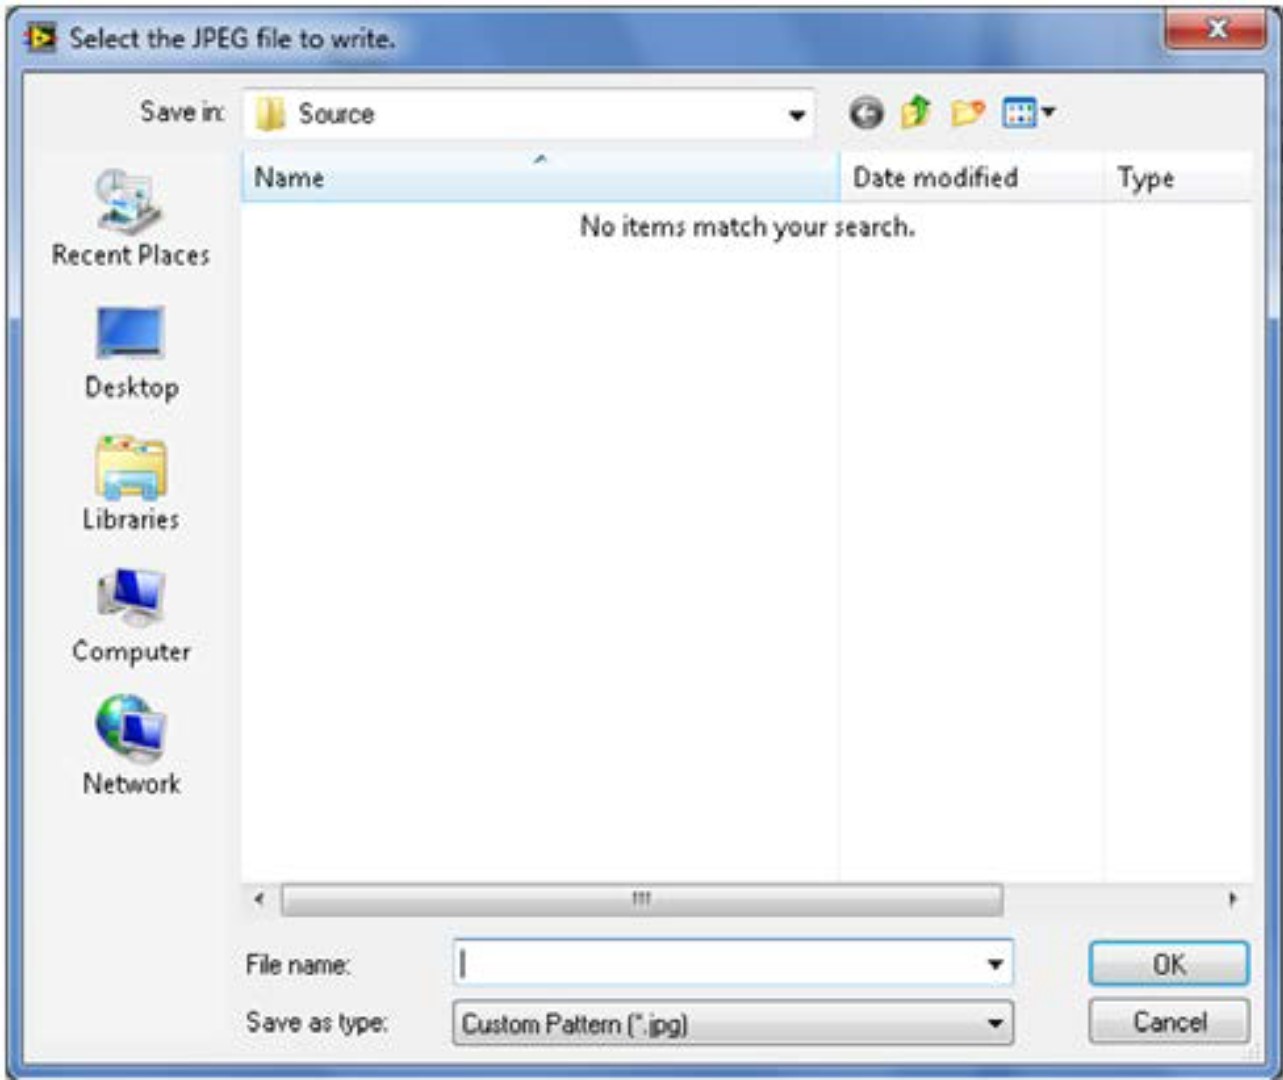
To save a screenshot, from the File menu, select Take Screenshot. The Select the JPEG file to write dialog box in Figure 20 opens. Save the file to an appropriate folder location. Screenshots are saved in .jpeg format and can be viewed with any picture viewer/editor.
Print Screenshot
To print a screenshot, from the File menu, select Print Screenshot. The screenshot is sent to the default printer. No dialog will appear when printing a screenshot.
Opening Files
Loading Captured Data
The software can load previously captured data for analysis.
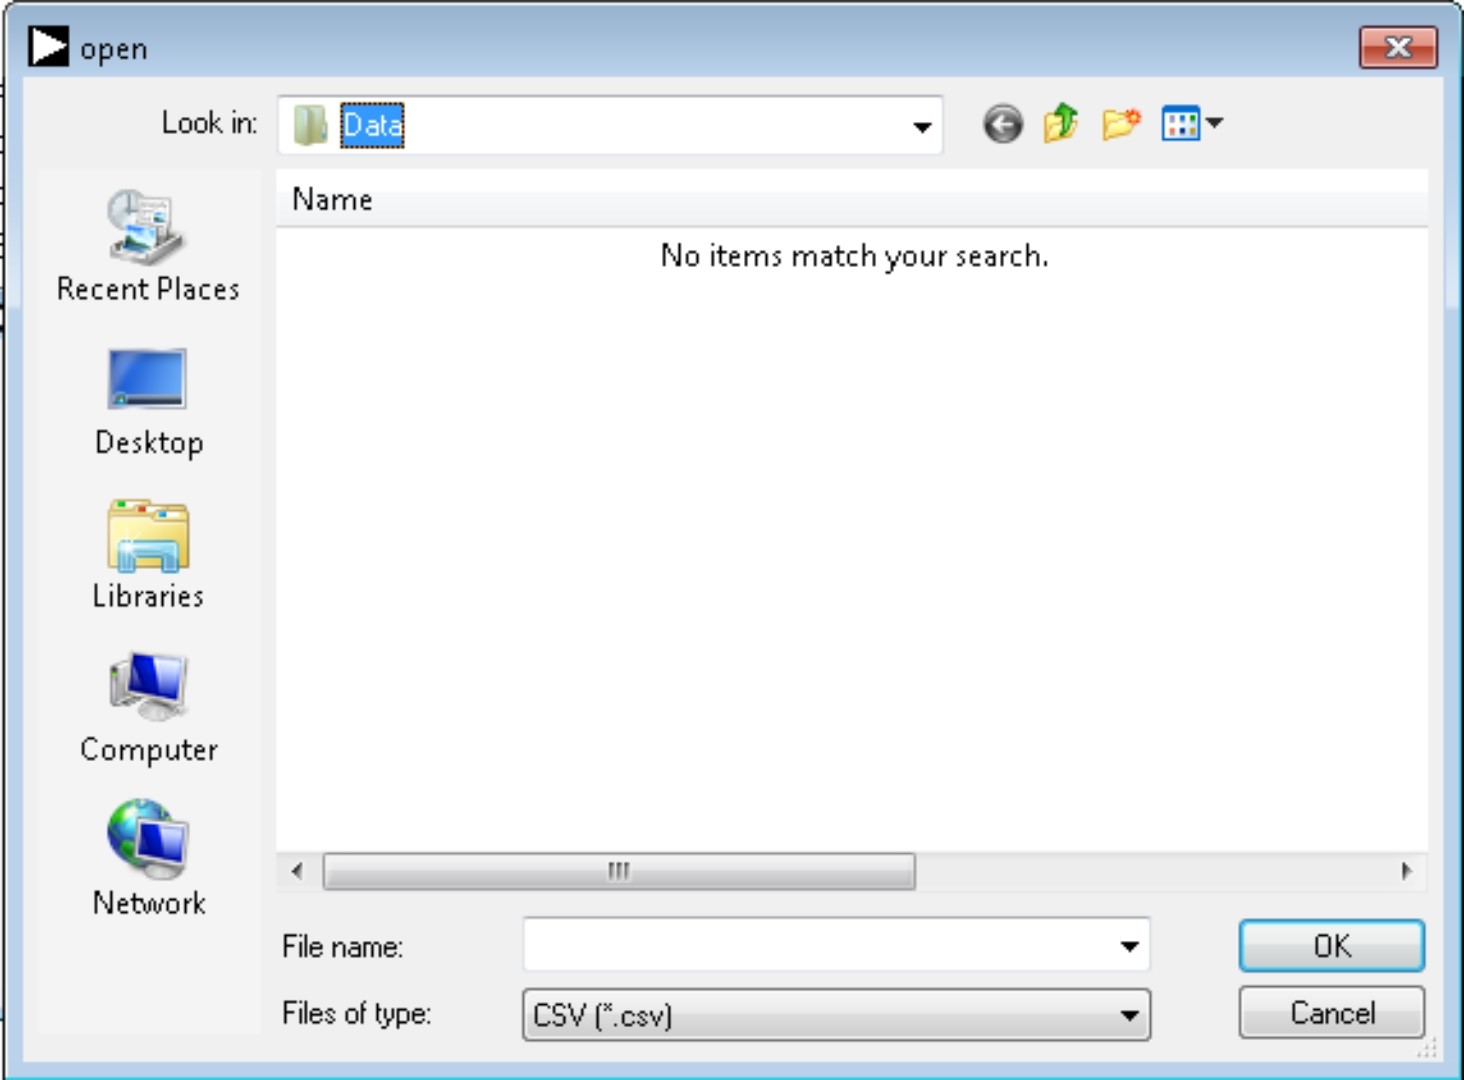
From the File menu, select Load Captured Data. Only data that was previously captured and saved can be opened. The raw data is used to rebuild the histogram and ac spectrum analyses upon being loaded into the evaluation platform.
When Load Captured Data is selected, the Open file dialog box in Figure 22 opens for loading an appropriate file. The evaluation software expects that a previously generated waveform file is in .csv format.