Streaming Data from the CN0549 into MATLAB
This page is going to discuss how to use the CN0549 Machine Learning Enablement Platform for streaming high fidelity analog sensor data from a device under test (DUT), into MATLAB for data analysis. The goal is that once you have the data in these tools, you’ll be able to create your own algorithms and train your system using your own data.
This page will outline how to get the data from the sensor all the way to MATLAB, using open-source hardware and software from Analog Devices. At the end of this page, links will also be provided to specific examples done in MATLAB, where you can recreate each example using the training data and scripts provided.
Requirements
Important
This user guide page assumes that you have the complete CN0549 system put together. This includes both hardware and software setup. If you have not completed this step, please refer back to the CN0549 user guide on how to get setup.
Hardware:
Ethernet Cable
Router or network connection
Mini USB to USB type A cable
PC or Laptop
Software:
-
Note this toolbox has other dependent toolboxes from MathWorks
Preparing your PC/Laptop
Install the following software onto your PC or laptop:
MATLAB
Libiio
ADI Sensor Toolbox from GitHub or directly from within MATLAB using Add-On explorer by searching for the Analog Devices Sensor Toolbox
System Setup
Ensure your CN0549 System is connected together. If you need to setup the CN0549, please refer back to the user guide.
Tip
The user guide shows the USB OTG connector and the HDMI cable installed, but those two steps will not be needed here since we are streaming data over the network into the laptop.
Connect one end of the Ethernet cable into the DE10-Nano, and the other end of the Ethernet cable into a router or other network connection.
Plug the mini USB cable into the UART connector of the DE10-Nano.
Plug in the USB cable(from the UART of DE10-Nano) into your PC’s USB port.
A driver for the board should automatically be detected and installed on your PC. If this does not happen you may have to manually install that driver in order to continue. Here is a link to the UART Serial Driver
Plug the power supply into the wall outlet and use the DC barrel jack to power up the CN0549 setup.
Finding your DE10-Nano
Before you can start gathering data, you first must locate the CN0549 system setup on your network.
Setup a UART serial communication between your PC and the DE10-Nano board using the micro USB cable to USB type A.
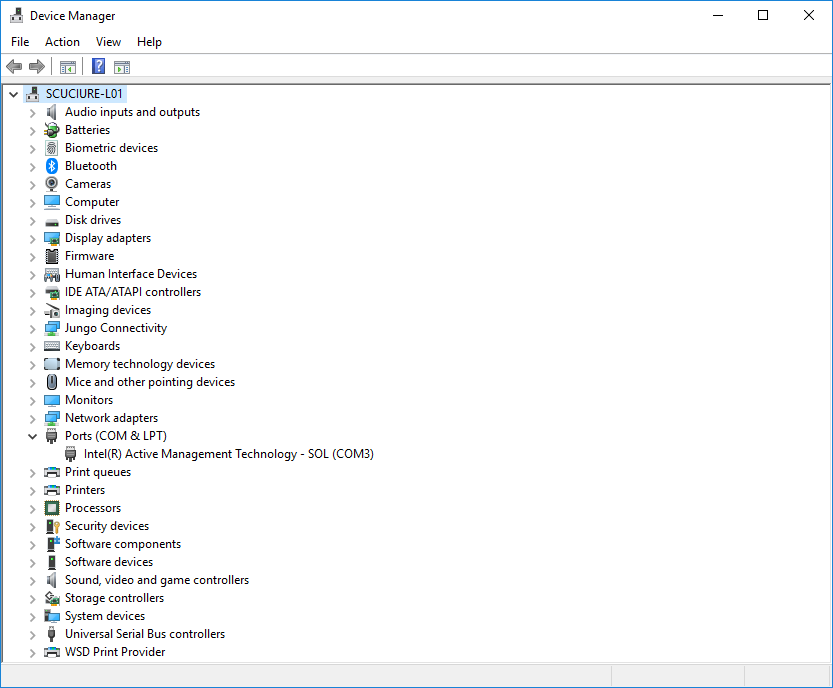
Using your device manager, locate the COM port assigned to the DE10-Nano board.
Open Putty, Tera Term, or other serial terminal program and open a terminal between the COM port the DE10-Nano board by setting the Baud rate to 115200, and clicking “Connect”.
You’ll now be prompted to provide a user name and password.
Note
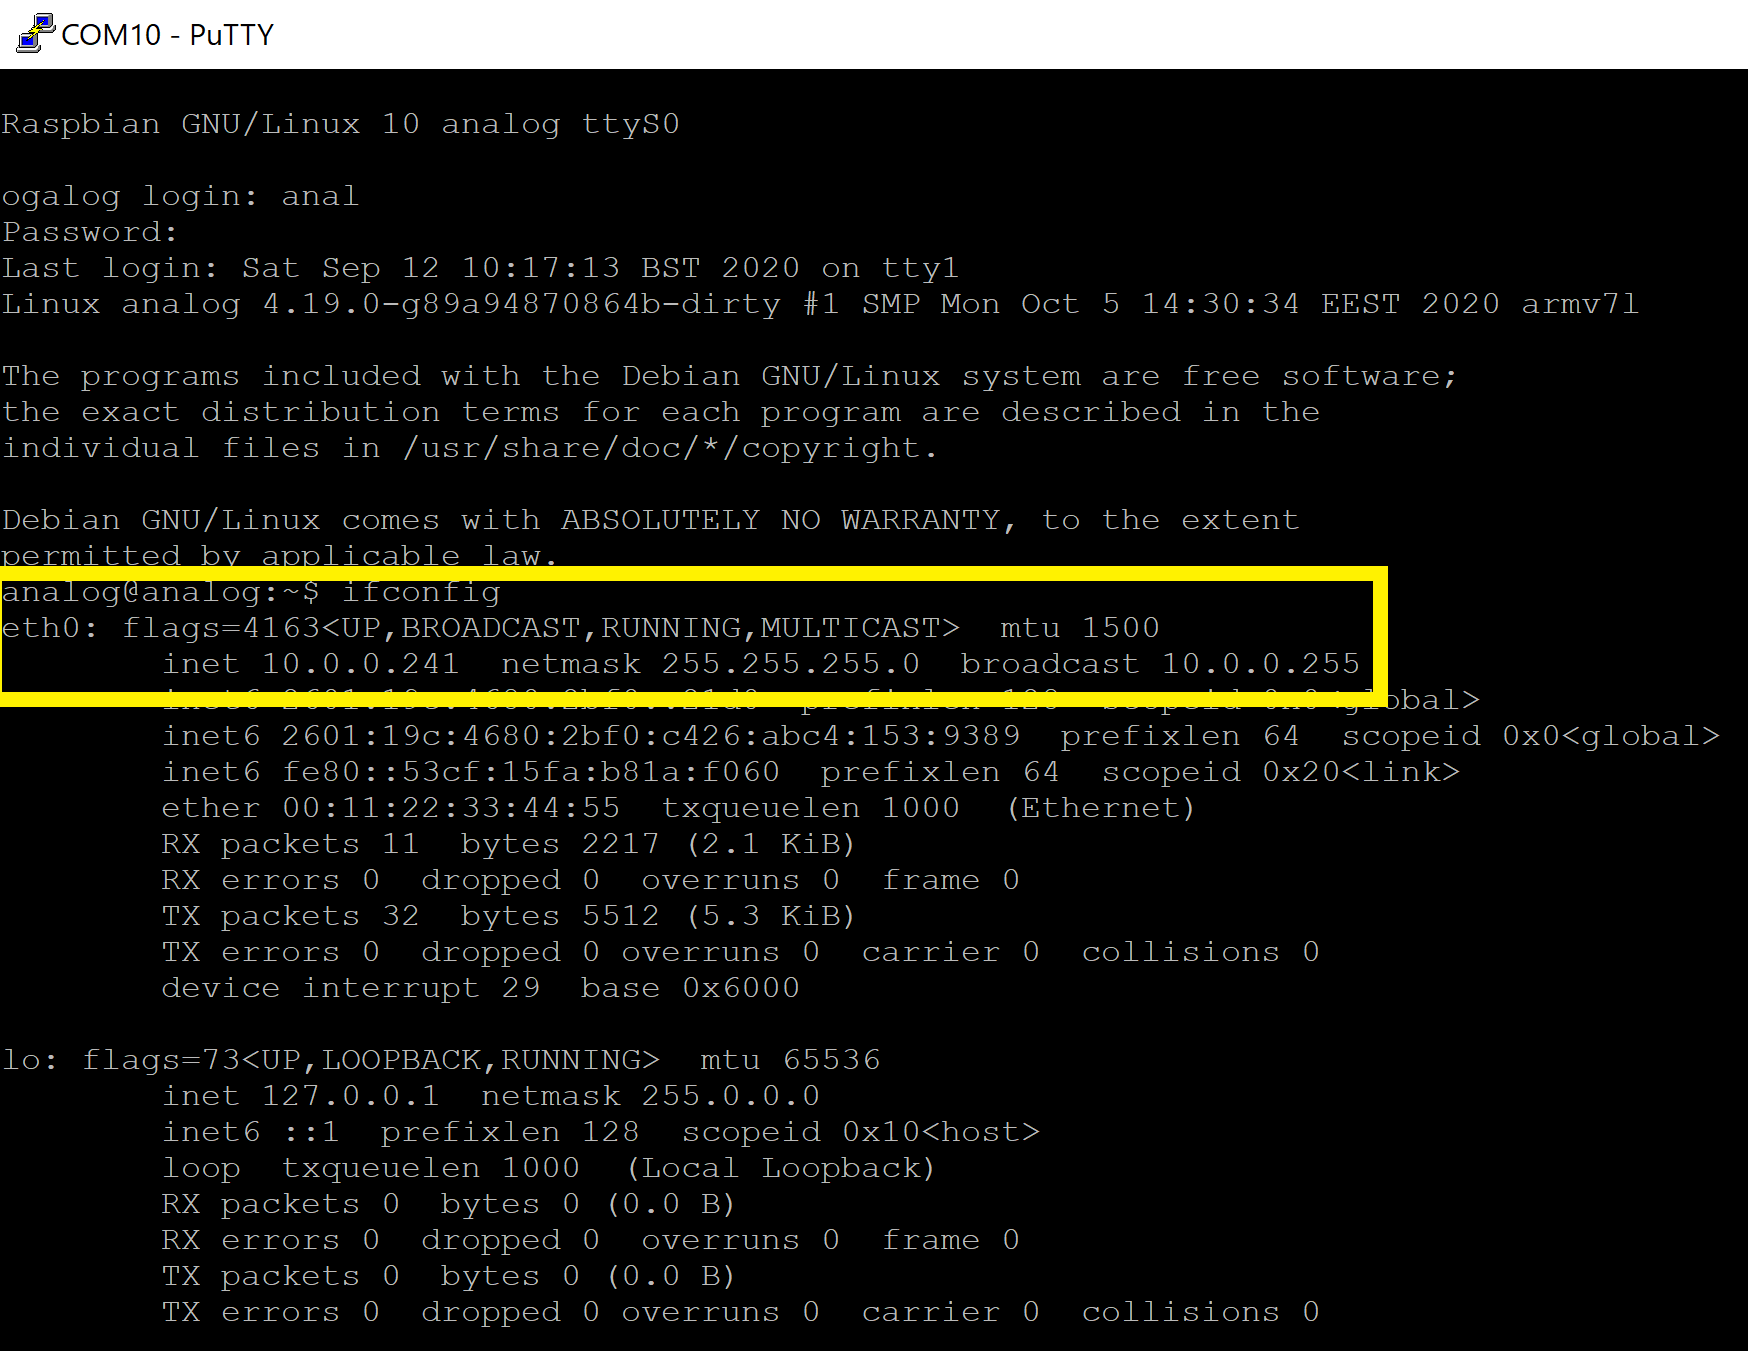
Type ifconfig into the terminal, hit “Enter”
That should echo back some information where you can pull out the inet address of eth0.
Connecting to the CN0549 via MATLAB
With your system fully setup, it’s now time to stream data directly into MATLAB.
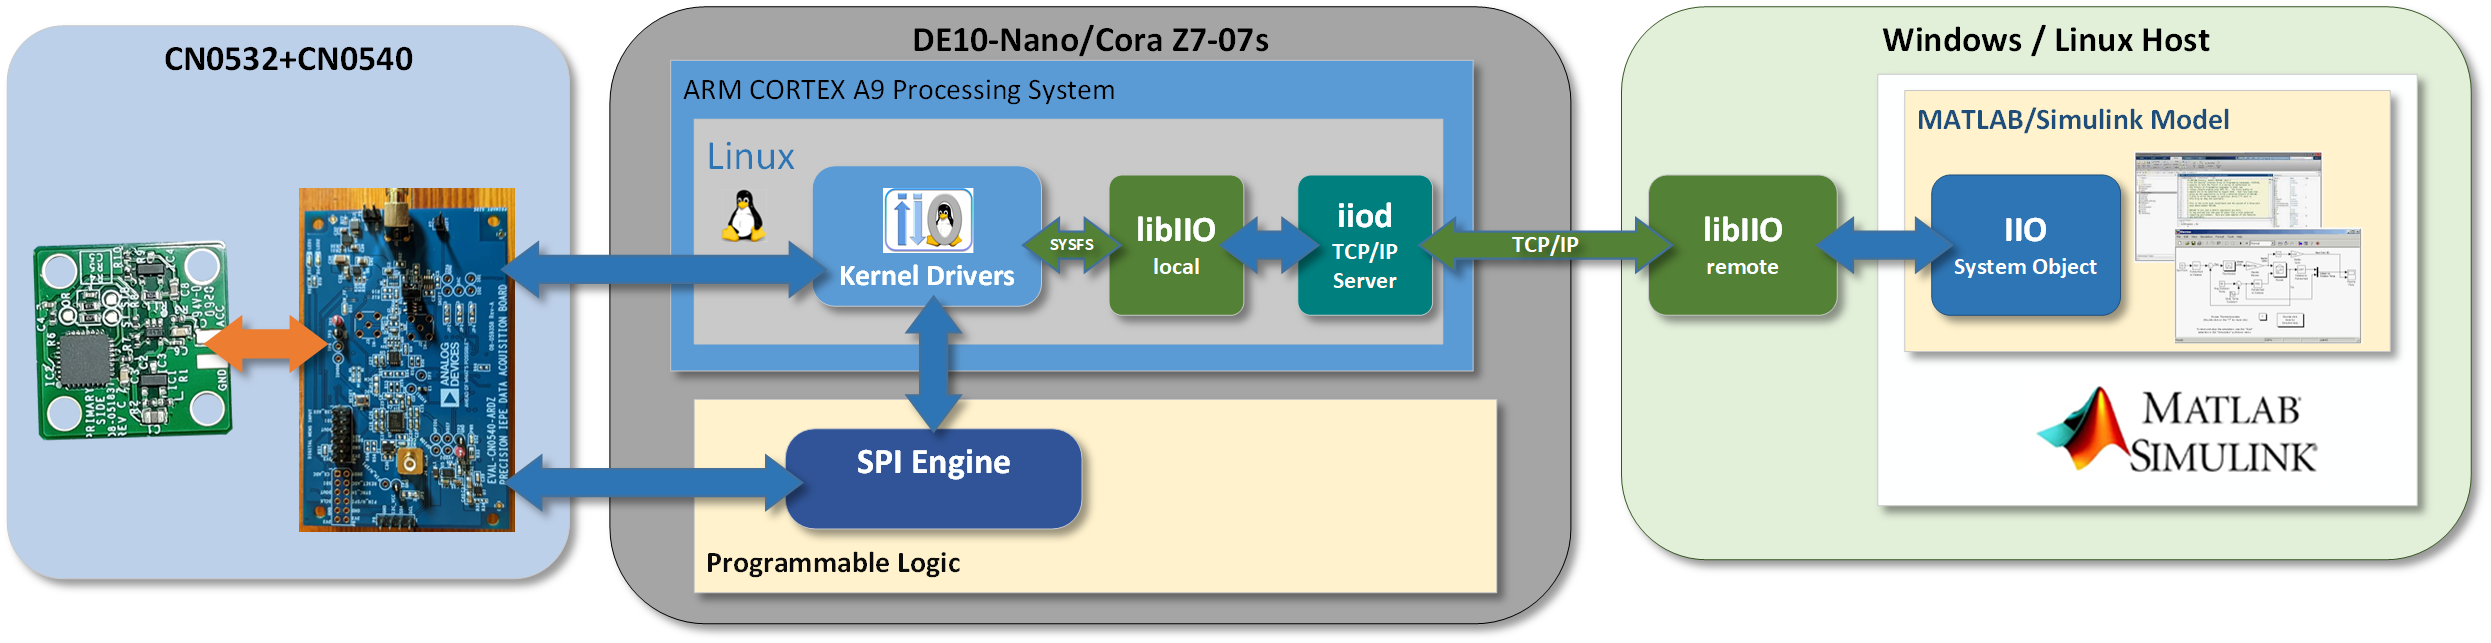
Data streaming and device control are provided through the specialized classes called MATLAB system objects in ADI’s Sensor Toolbox. Devices or sensors which connect through the CN0540, such as the CN0549, will share a common base class called adi.CN0540Base.m. However, each specific sensor will have its own class that will contain documentation, methods, and properties specific to it. Therefore, end-users should always use the python class associated with the sensor and not the CN0540.
Below is a basic example where we will talk to a CN0540 with CN0532 attached. This is done remotely from a host PC, but can be done locally on the board or through another backend. See the libiio doc for more information. This example can be downloaded from GitHub directly.
%% Configure device for initialization
xl = adi.CN0532();
xl.uri = uri;
xl.SampleRate = '16000';
xl.SamplesPerRead = 2^14;
xl.FDAMode = 'FullPower';
xl.ShiftVoltageMV = 4240;
%% Collect data
data = xl();
%% Plot data
ts = 1/str2double(xl.SampleRate);
t = 0:ts:(length(data)-1)*ts;
plot(t,data);
xlabel('Time (s)');ylabel('ADC Codes');grid on;
ylim([min(data)-abs(min(data)*0.01) max(data)+abs(max(data)*0.01)]);
Once run the return data data will be an array of 32-bit integers of shape (2^12,1). These are ADC codes as captured from the CN0540 board connected to the CN0532 sensor board.
For further details about ADI’s Sensor Toolbox consult the doc available directly in the toolbox, or look at more examples in the sensor_examples folder.
End of Document