Demo Modes
Low Noise Test Demo
The noise test demo is a useful mode to verify that the evaluation board is communicating correctly with the ACE plugin software.
Hardware setup for noise test
Insert all pins on the low noise test link (LK13 on AD7190–AD7194, JP4 on AD7195) to enable the low noise test mode. See the hardware guide for link option details.
Running the noise test
Double click the Eval Board icon to open the board view window. The demo wizard will be on the left, either collapsed or already expanded. Expand the wizard by clicking the arrow.
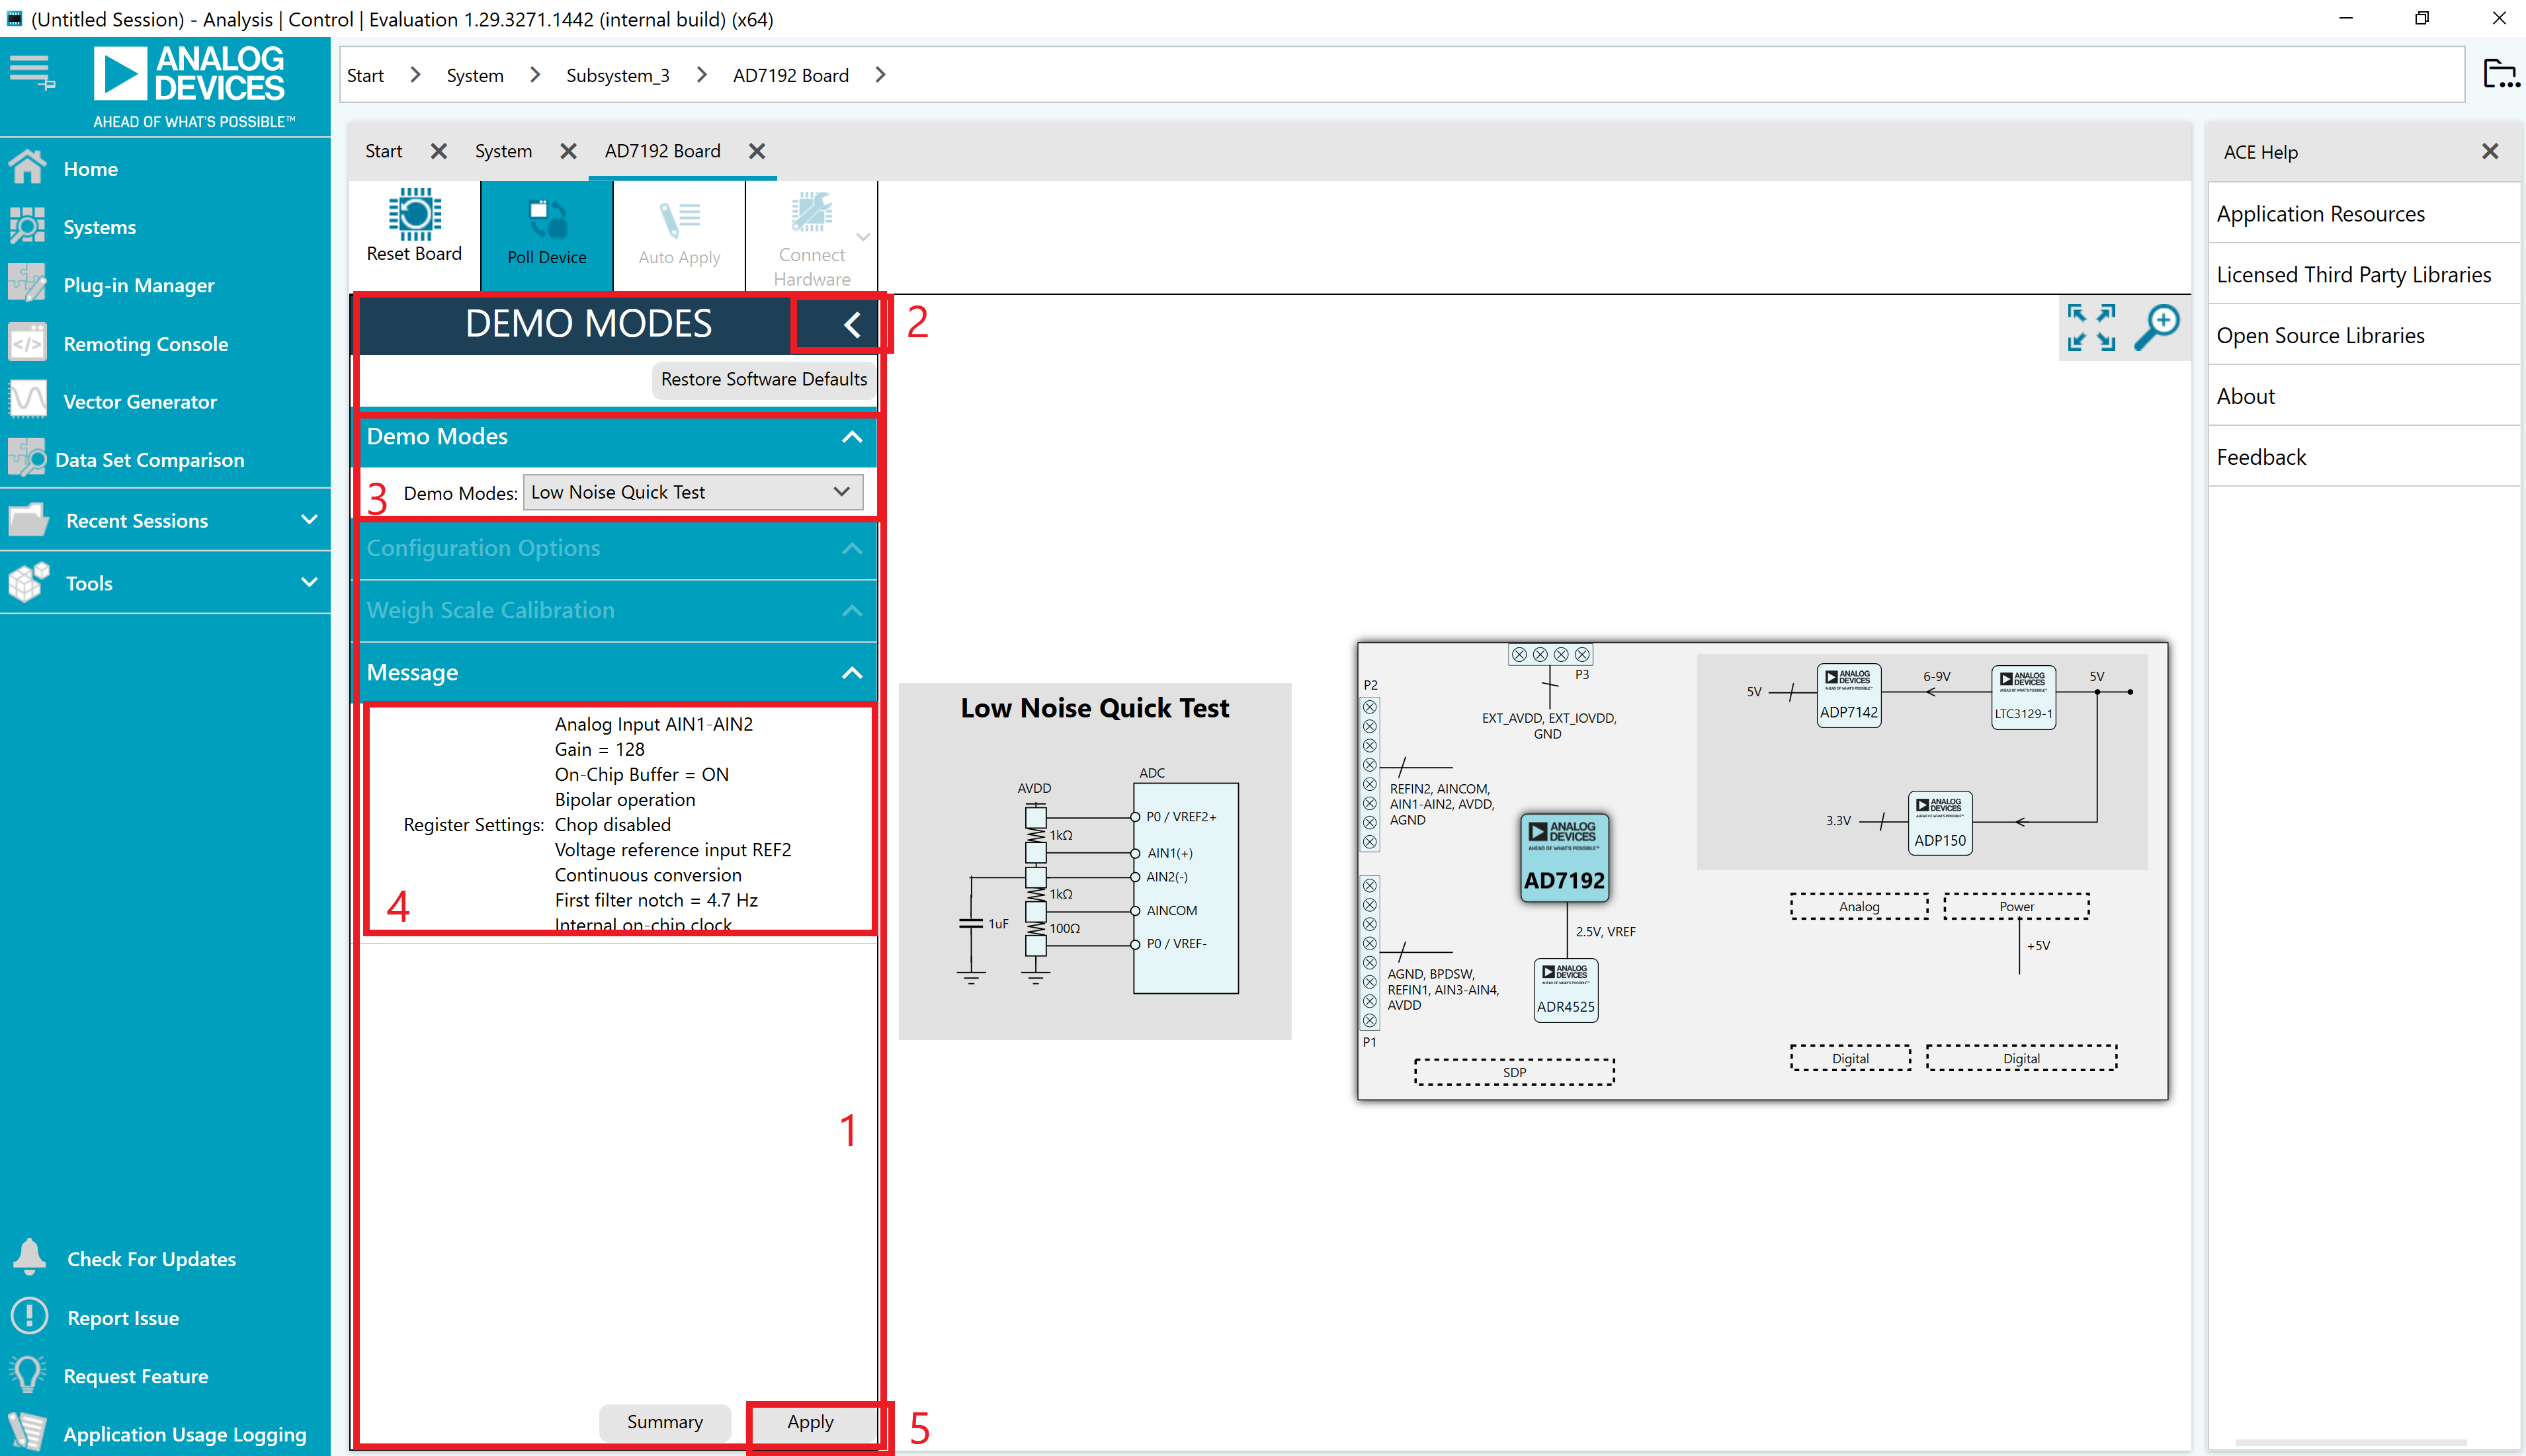
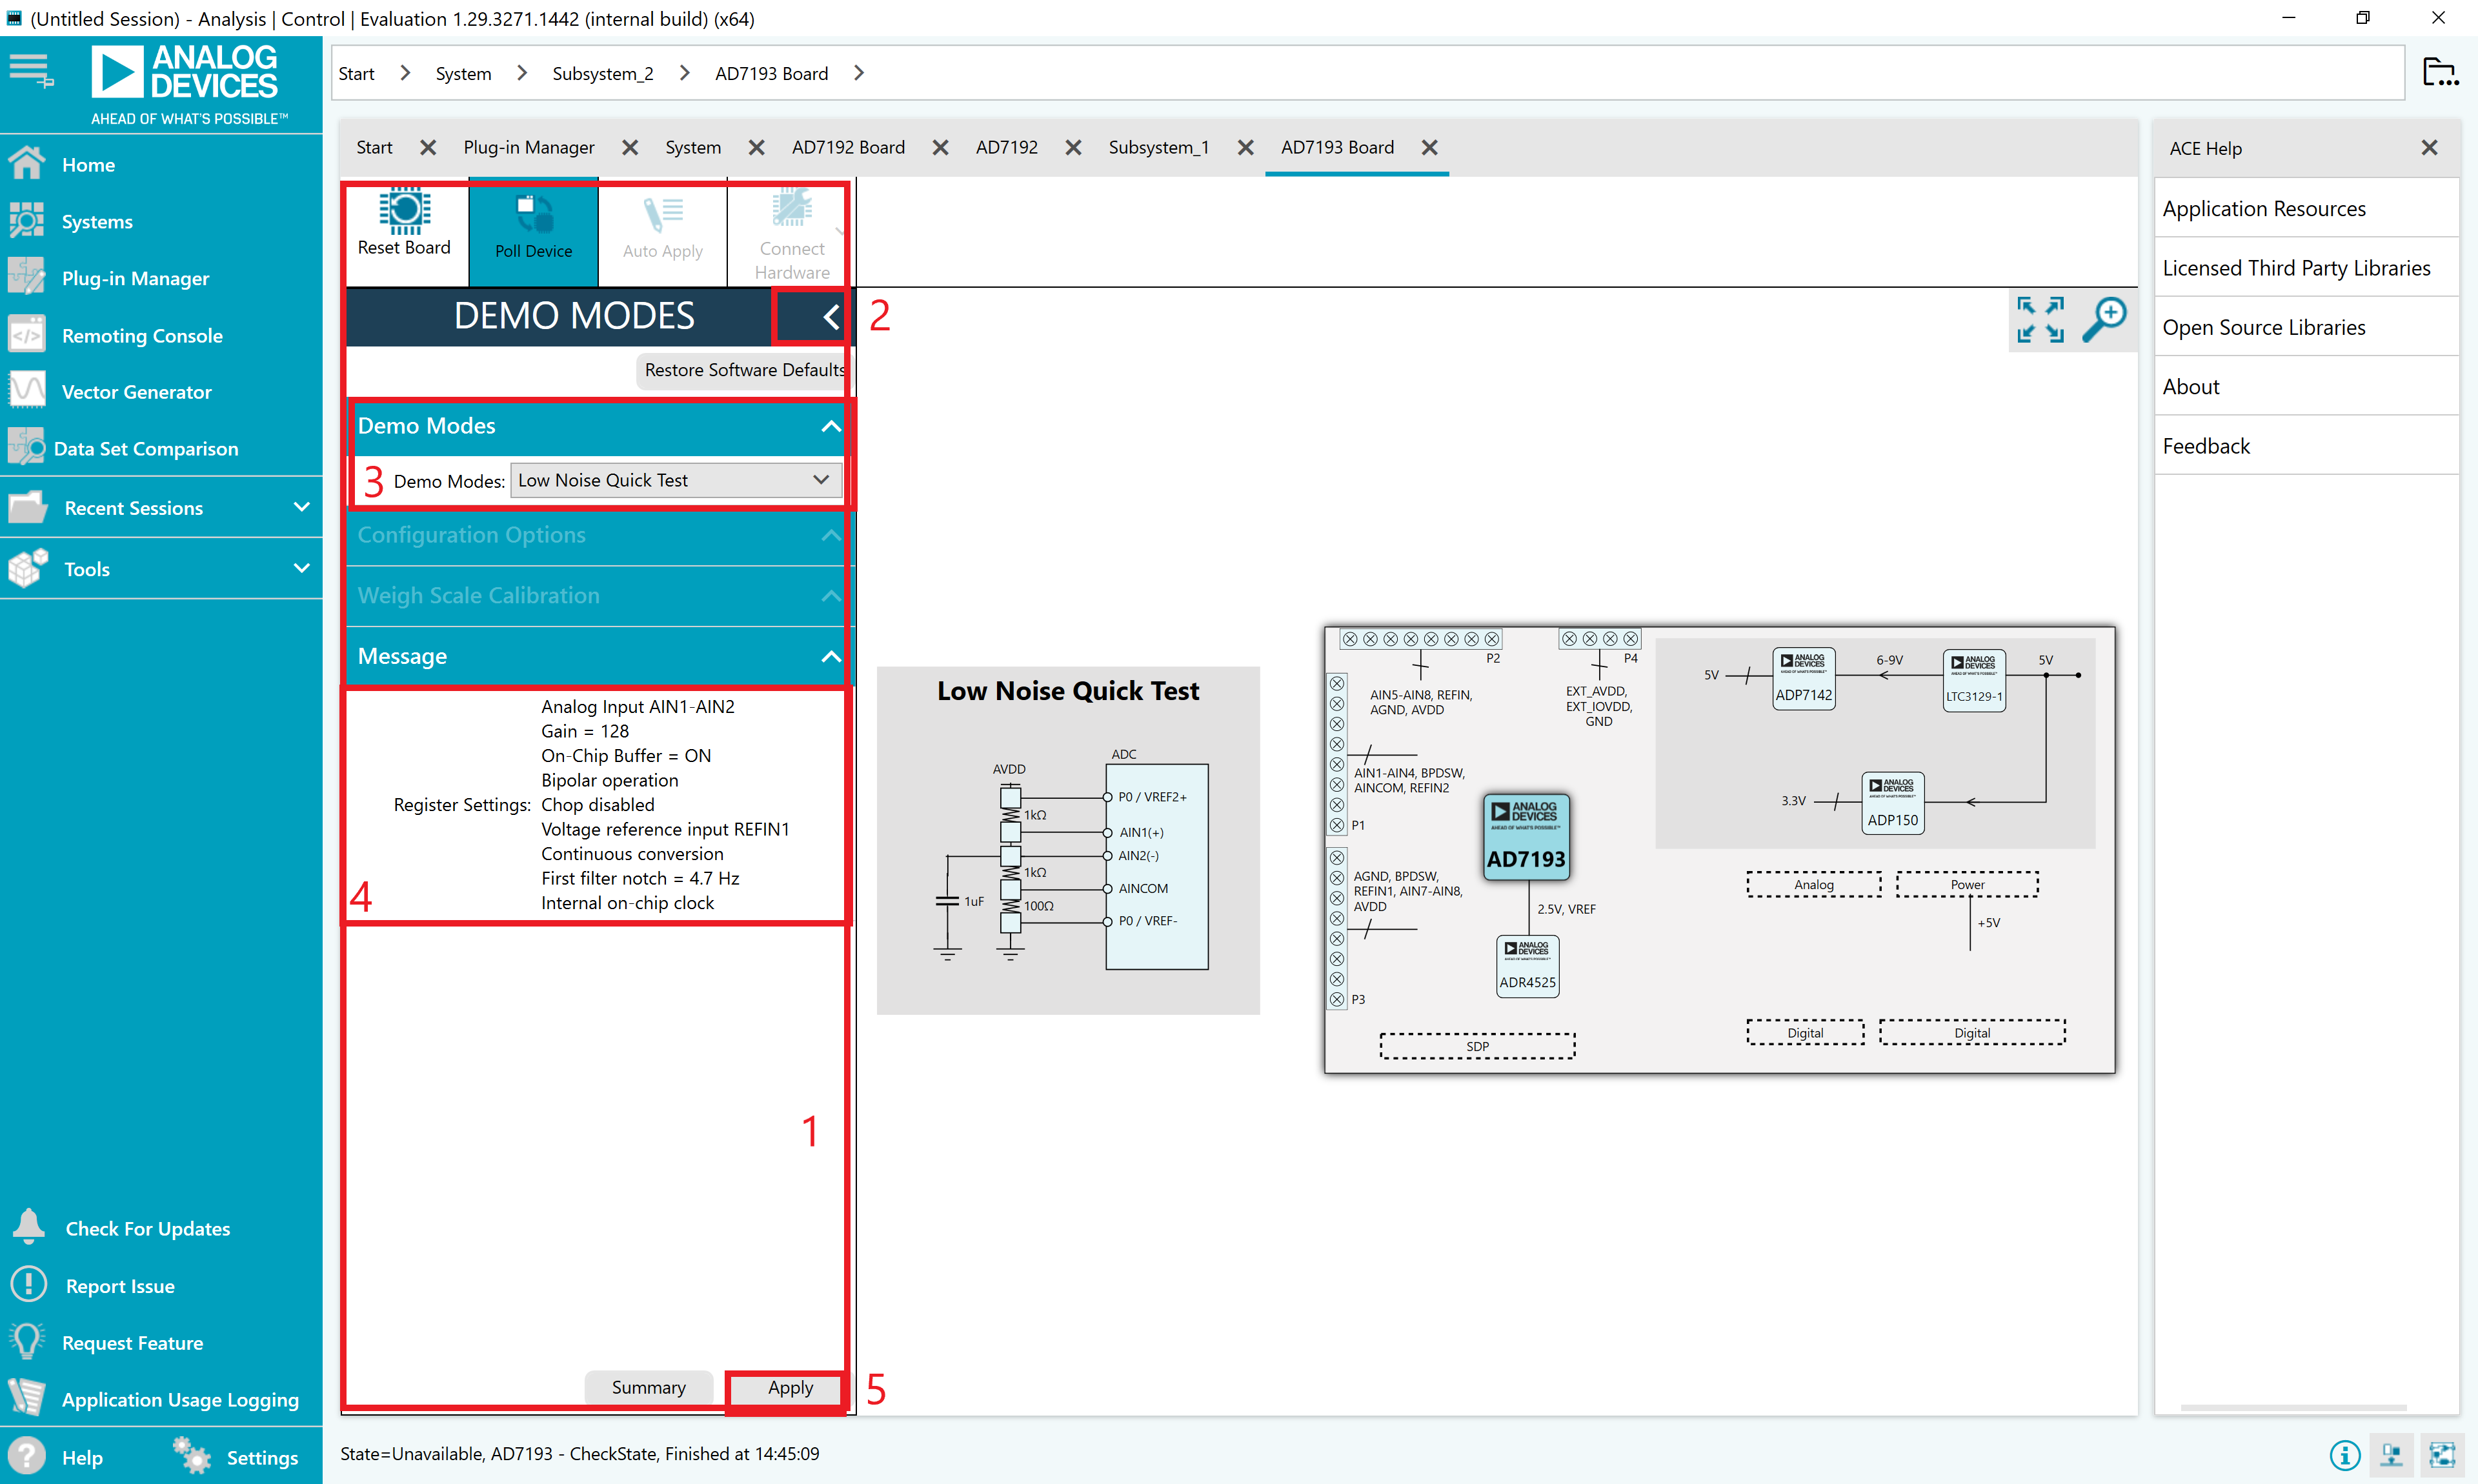

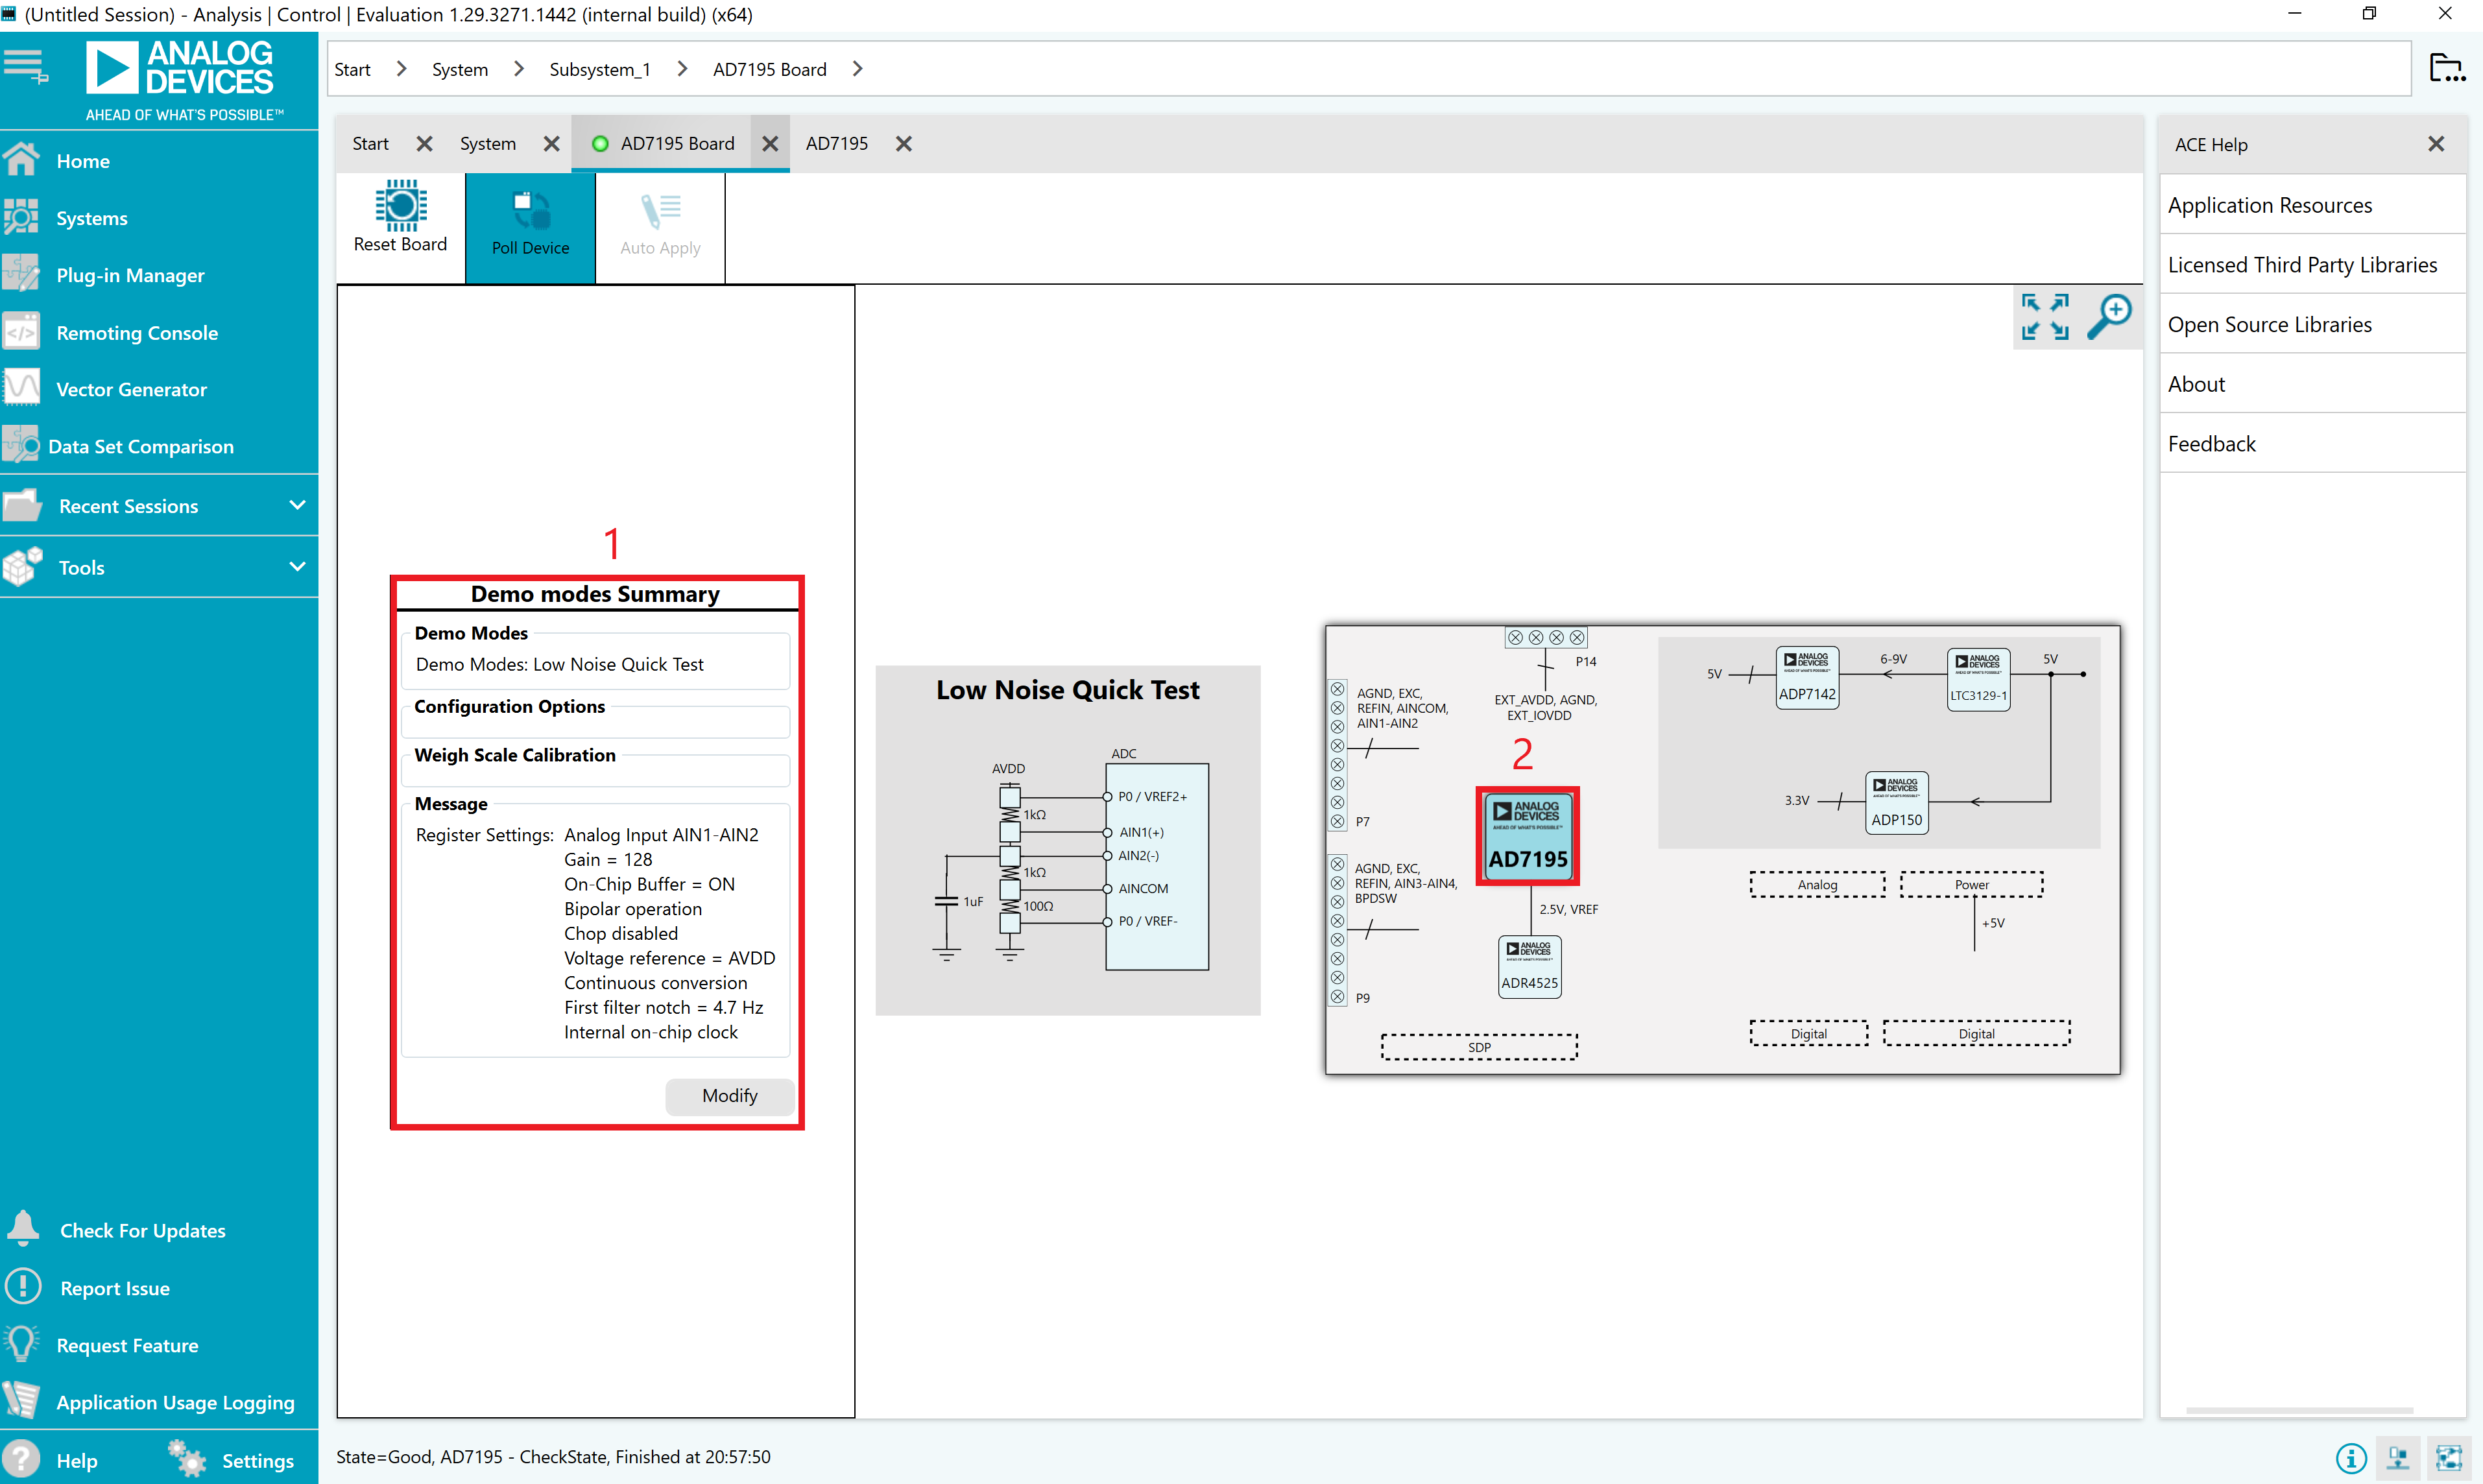
With the wizard expanded, select the noise test button.
The settings required for the demo are displayed to be viewed prior to writing to the device. Click Apply to write these settings to the board.
The summary is then displayed once the write is complete.
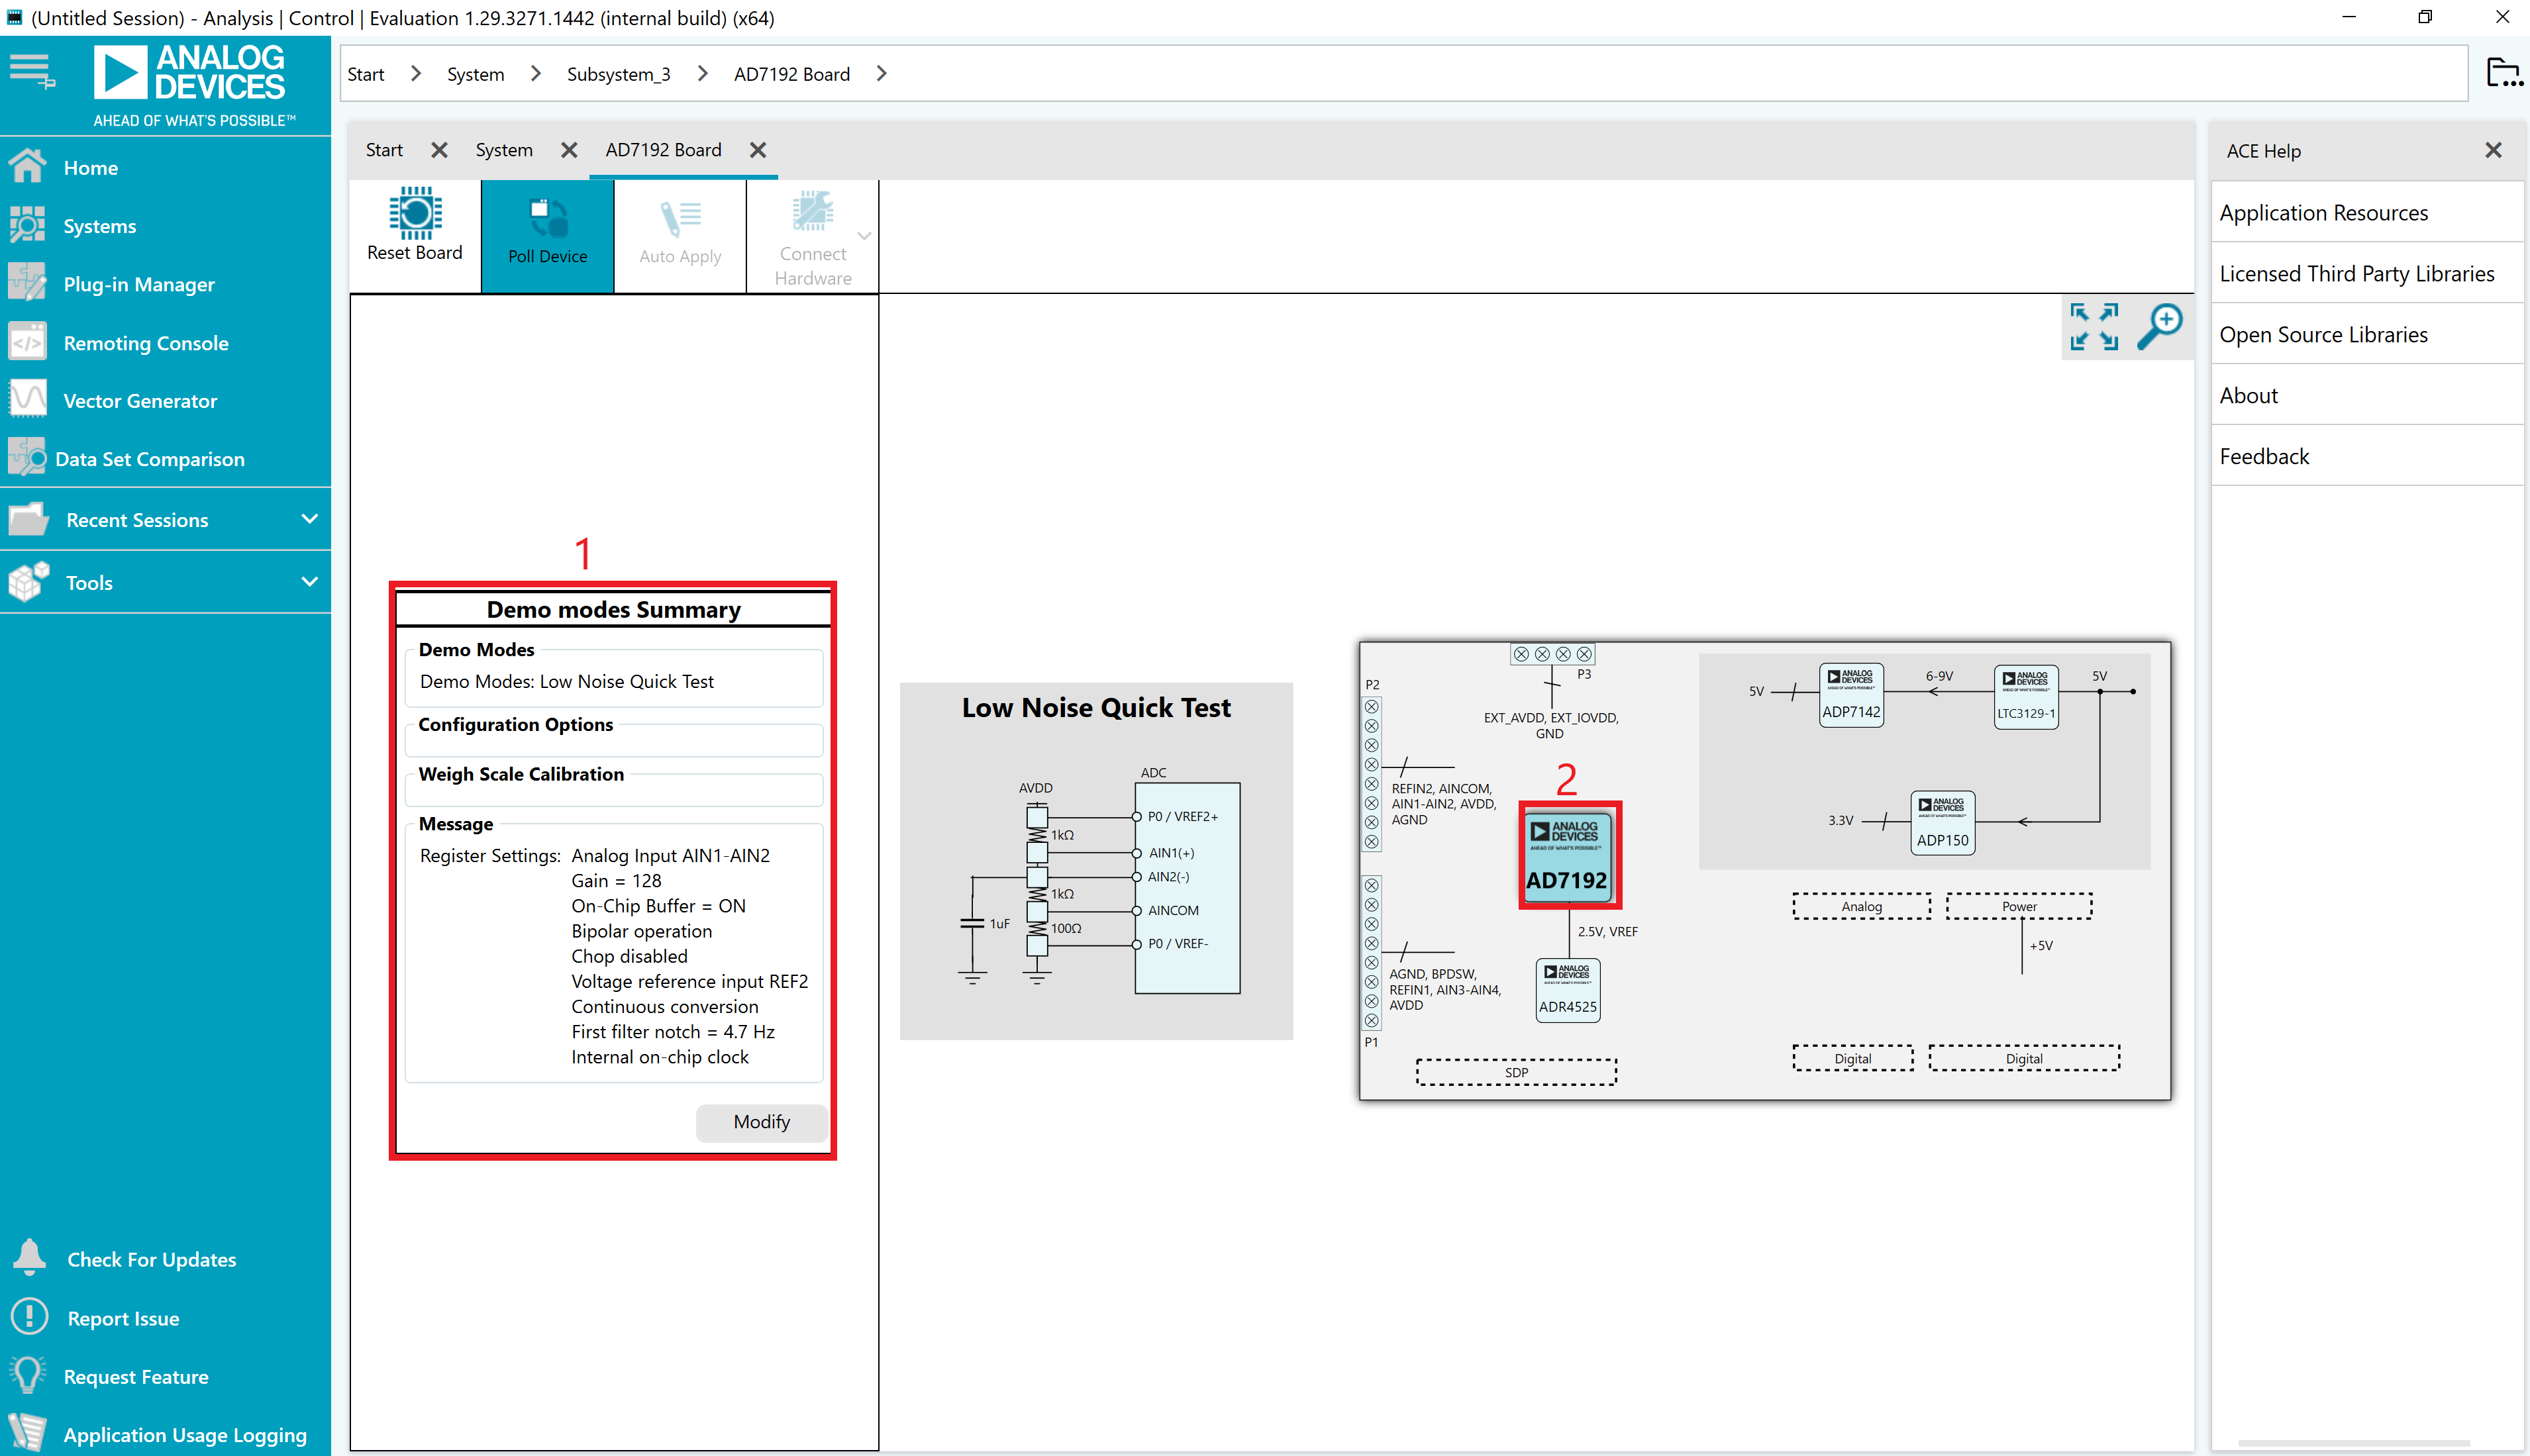
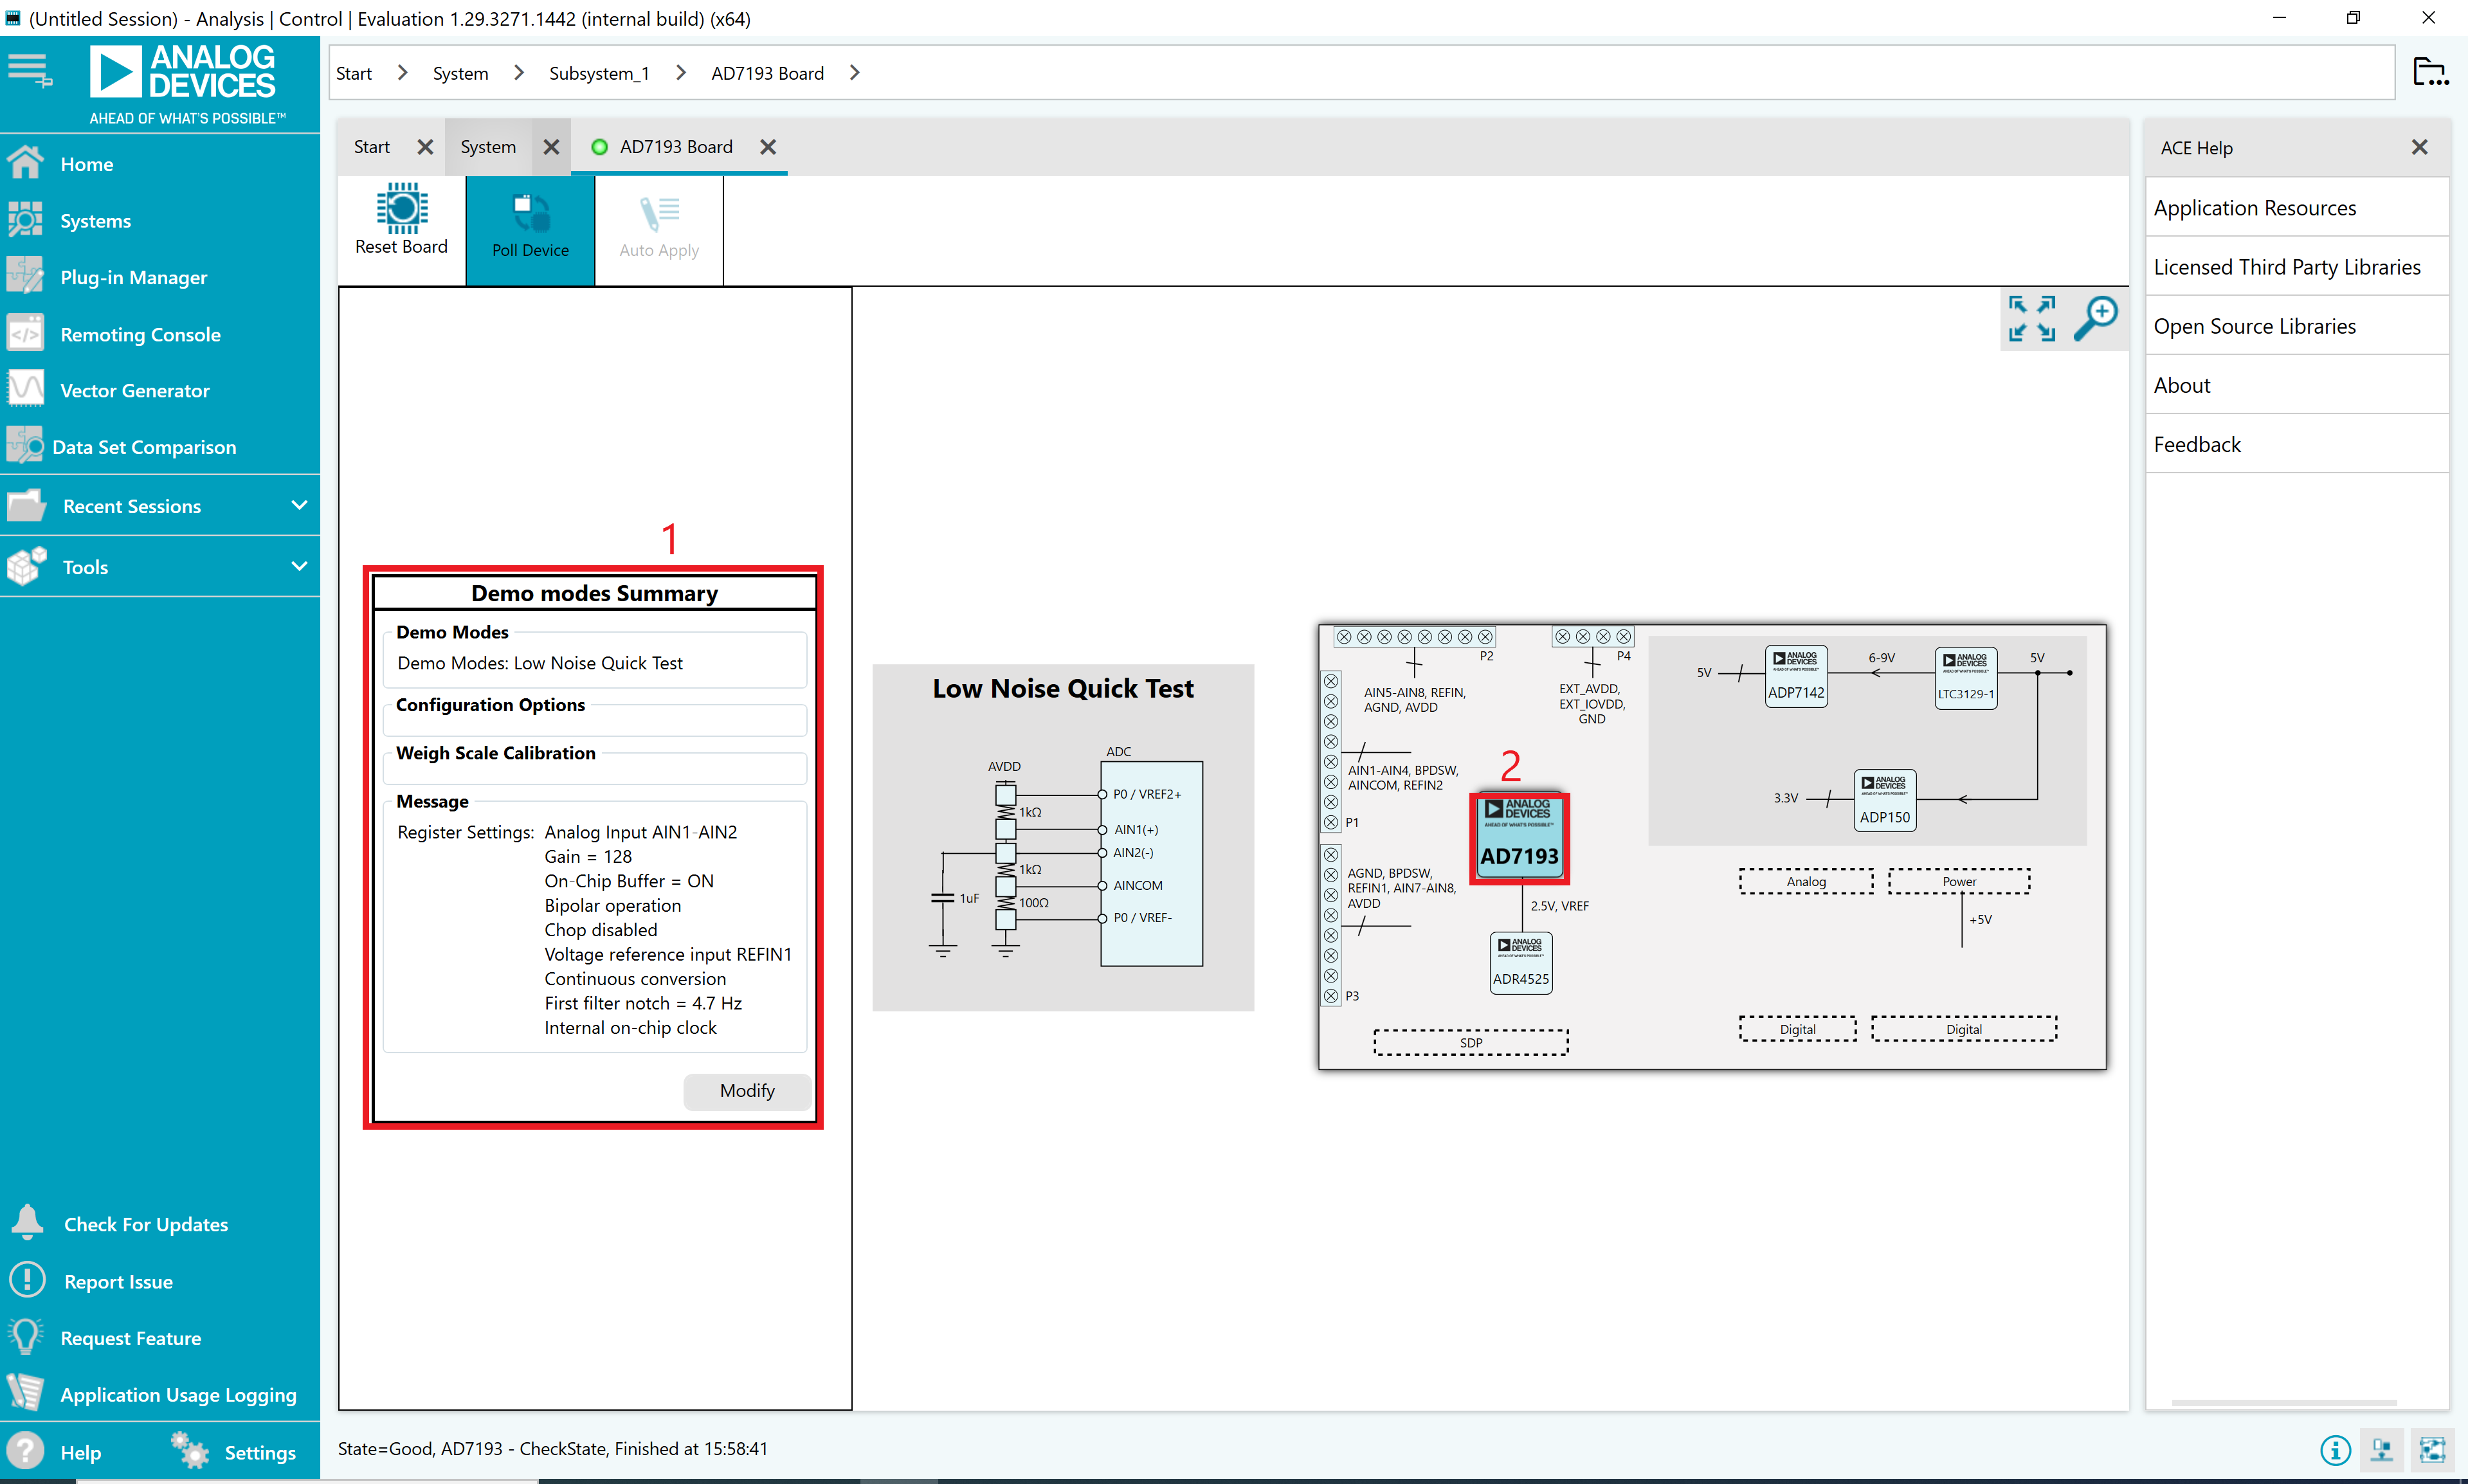
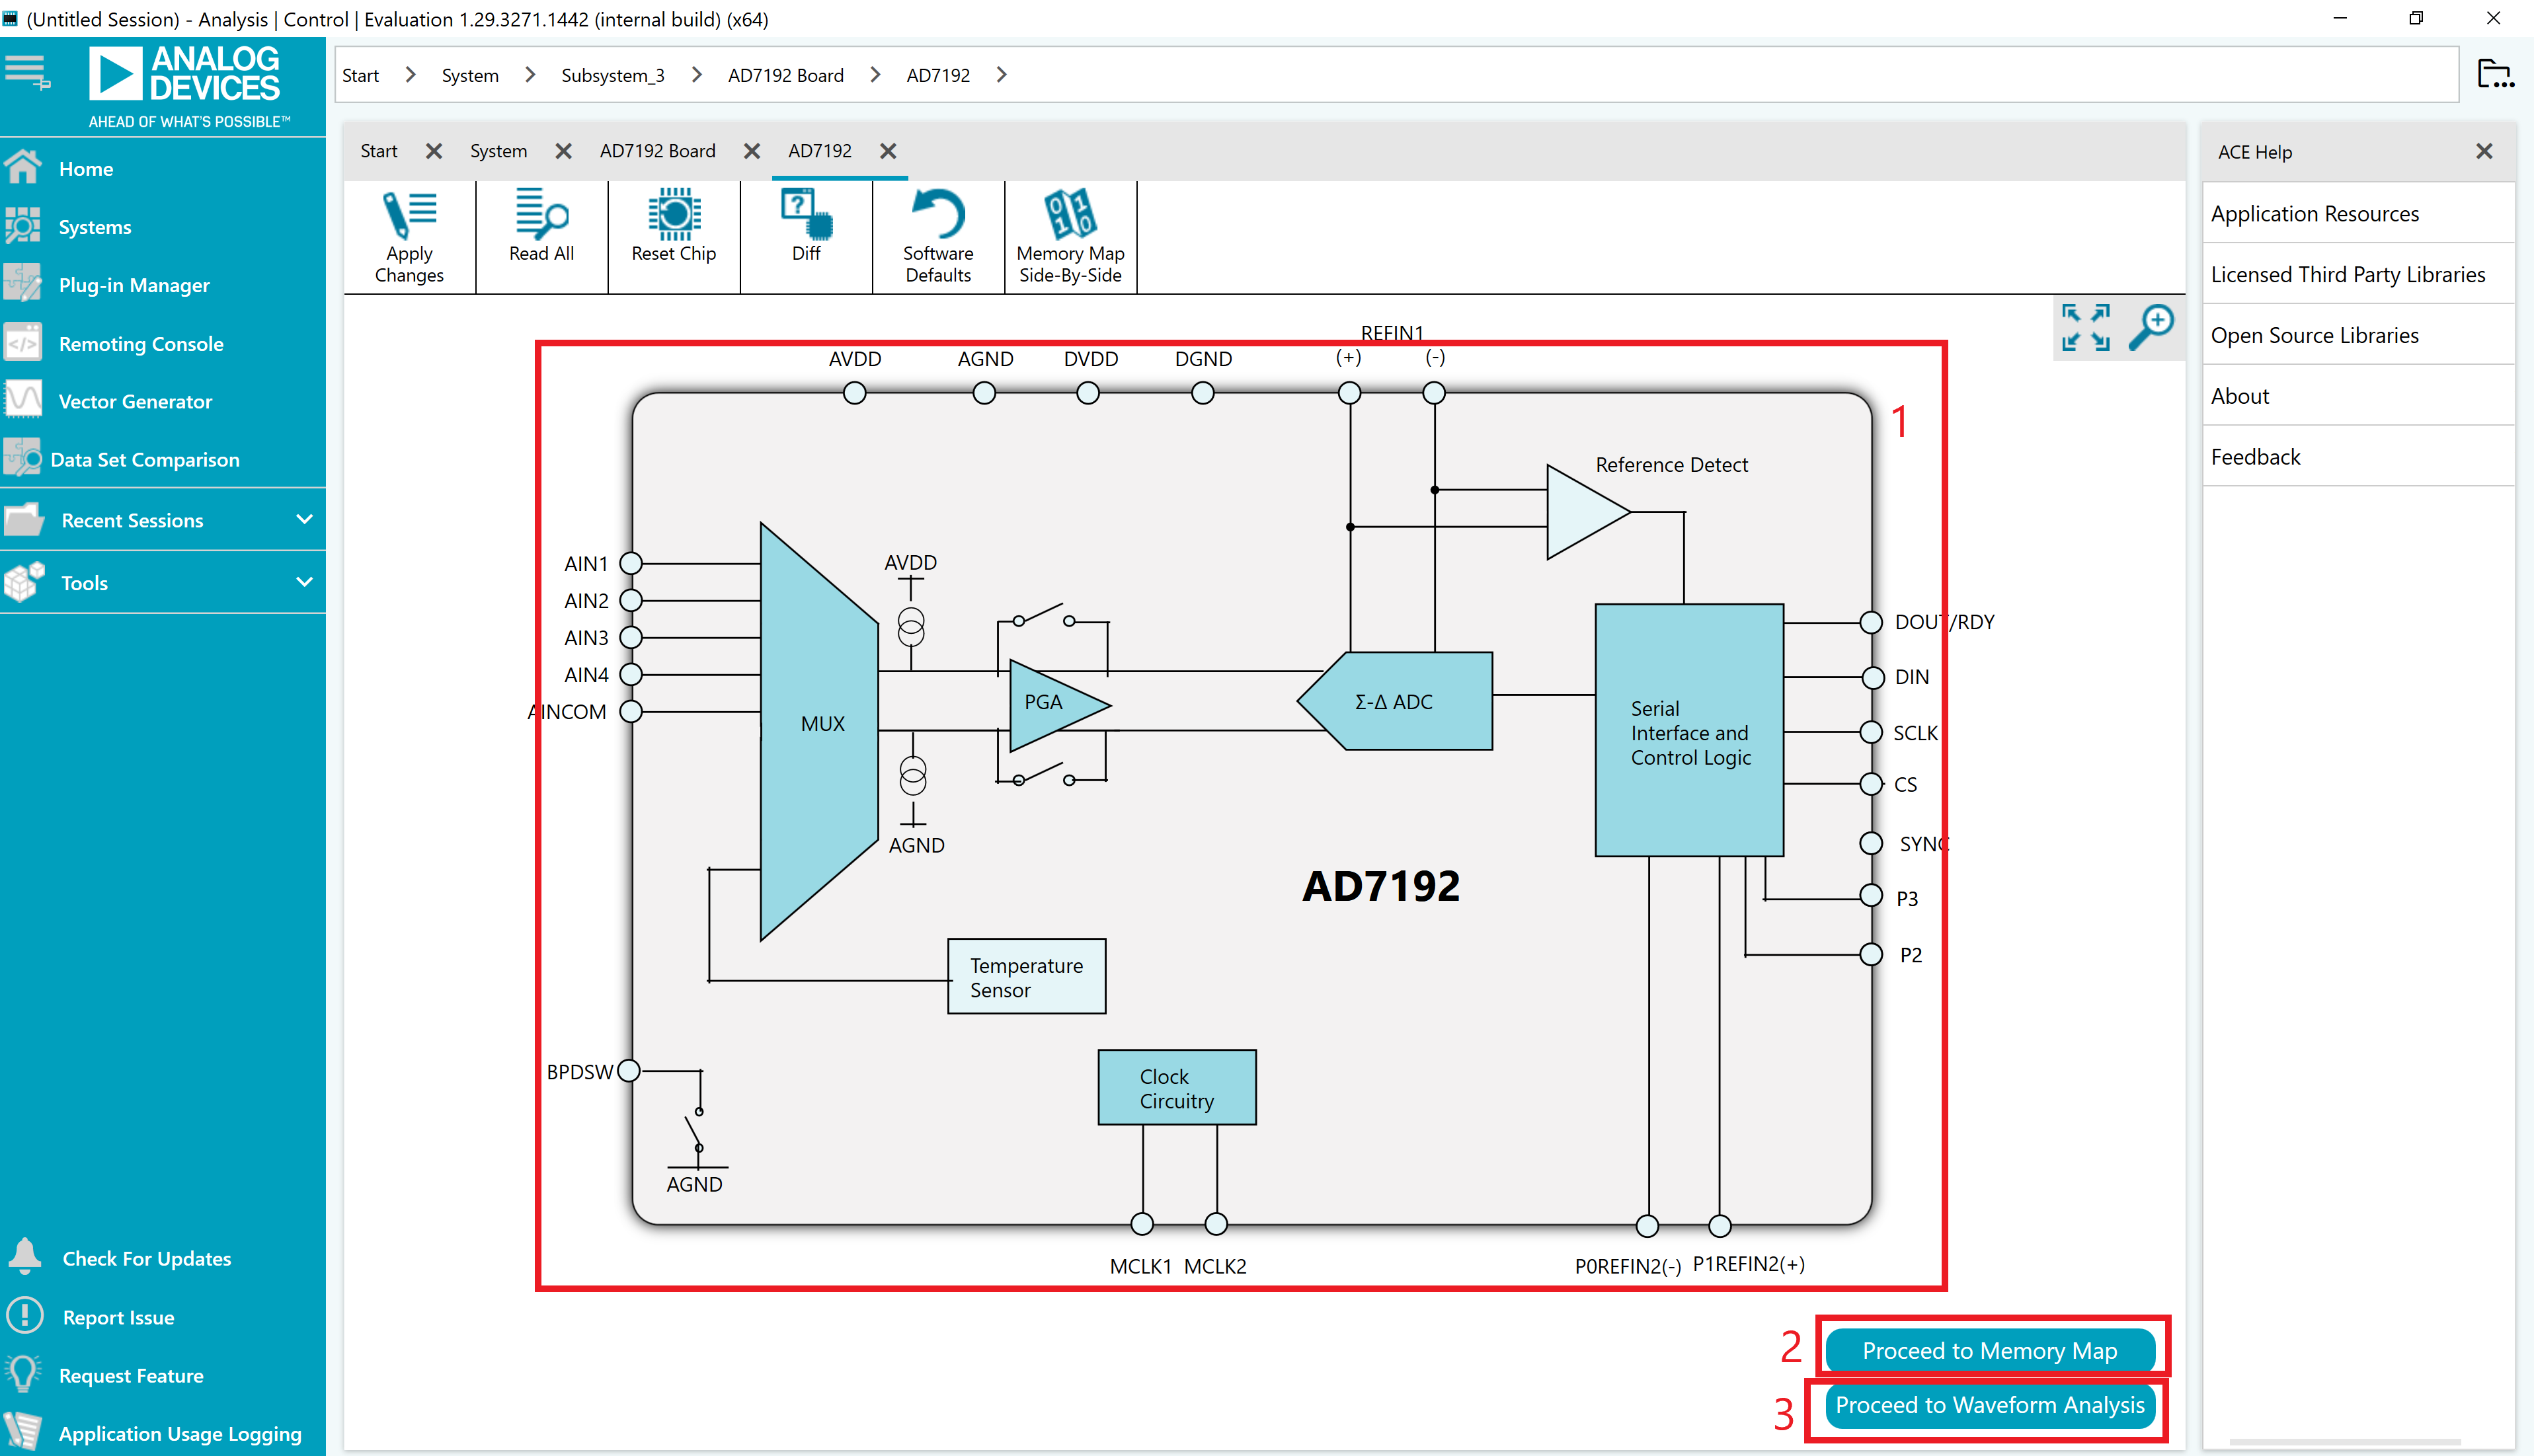
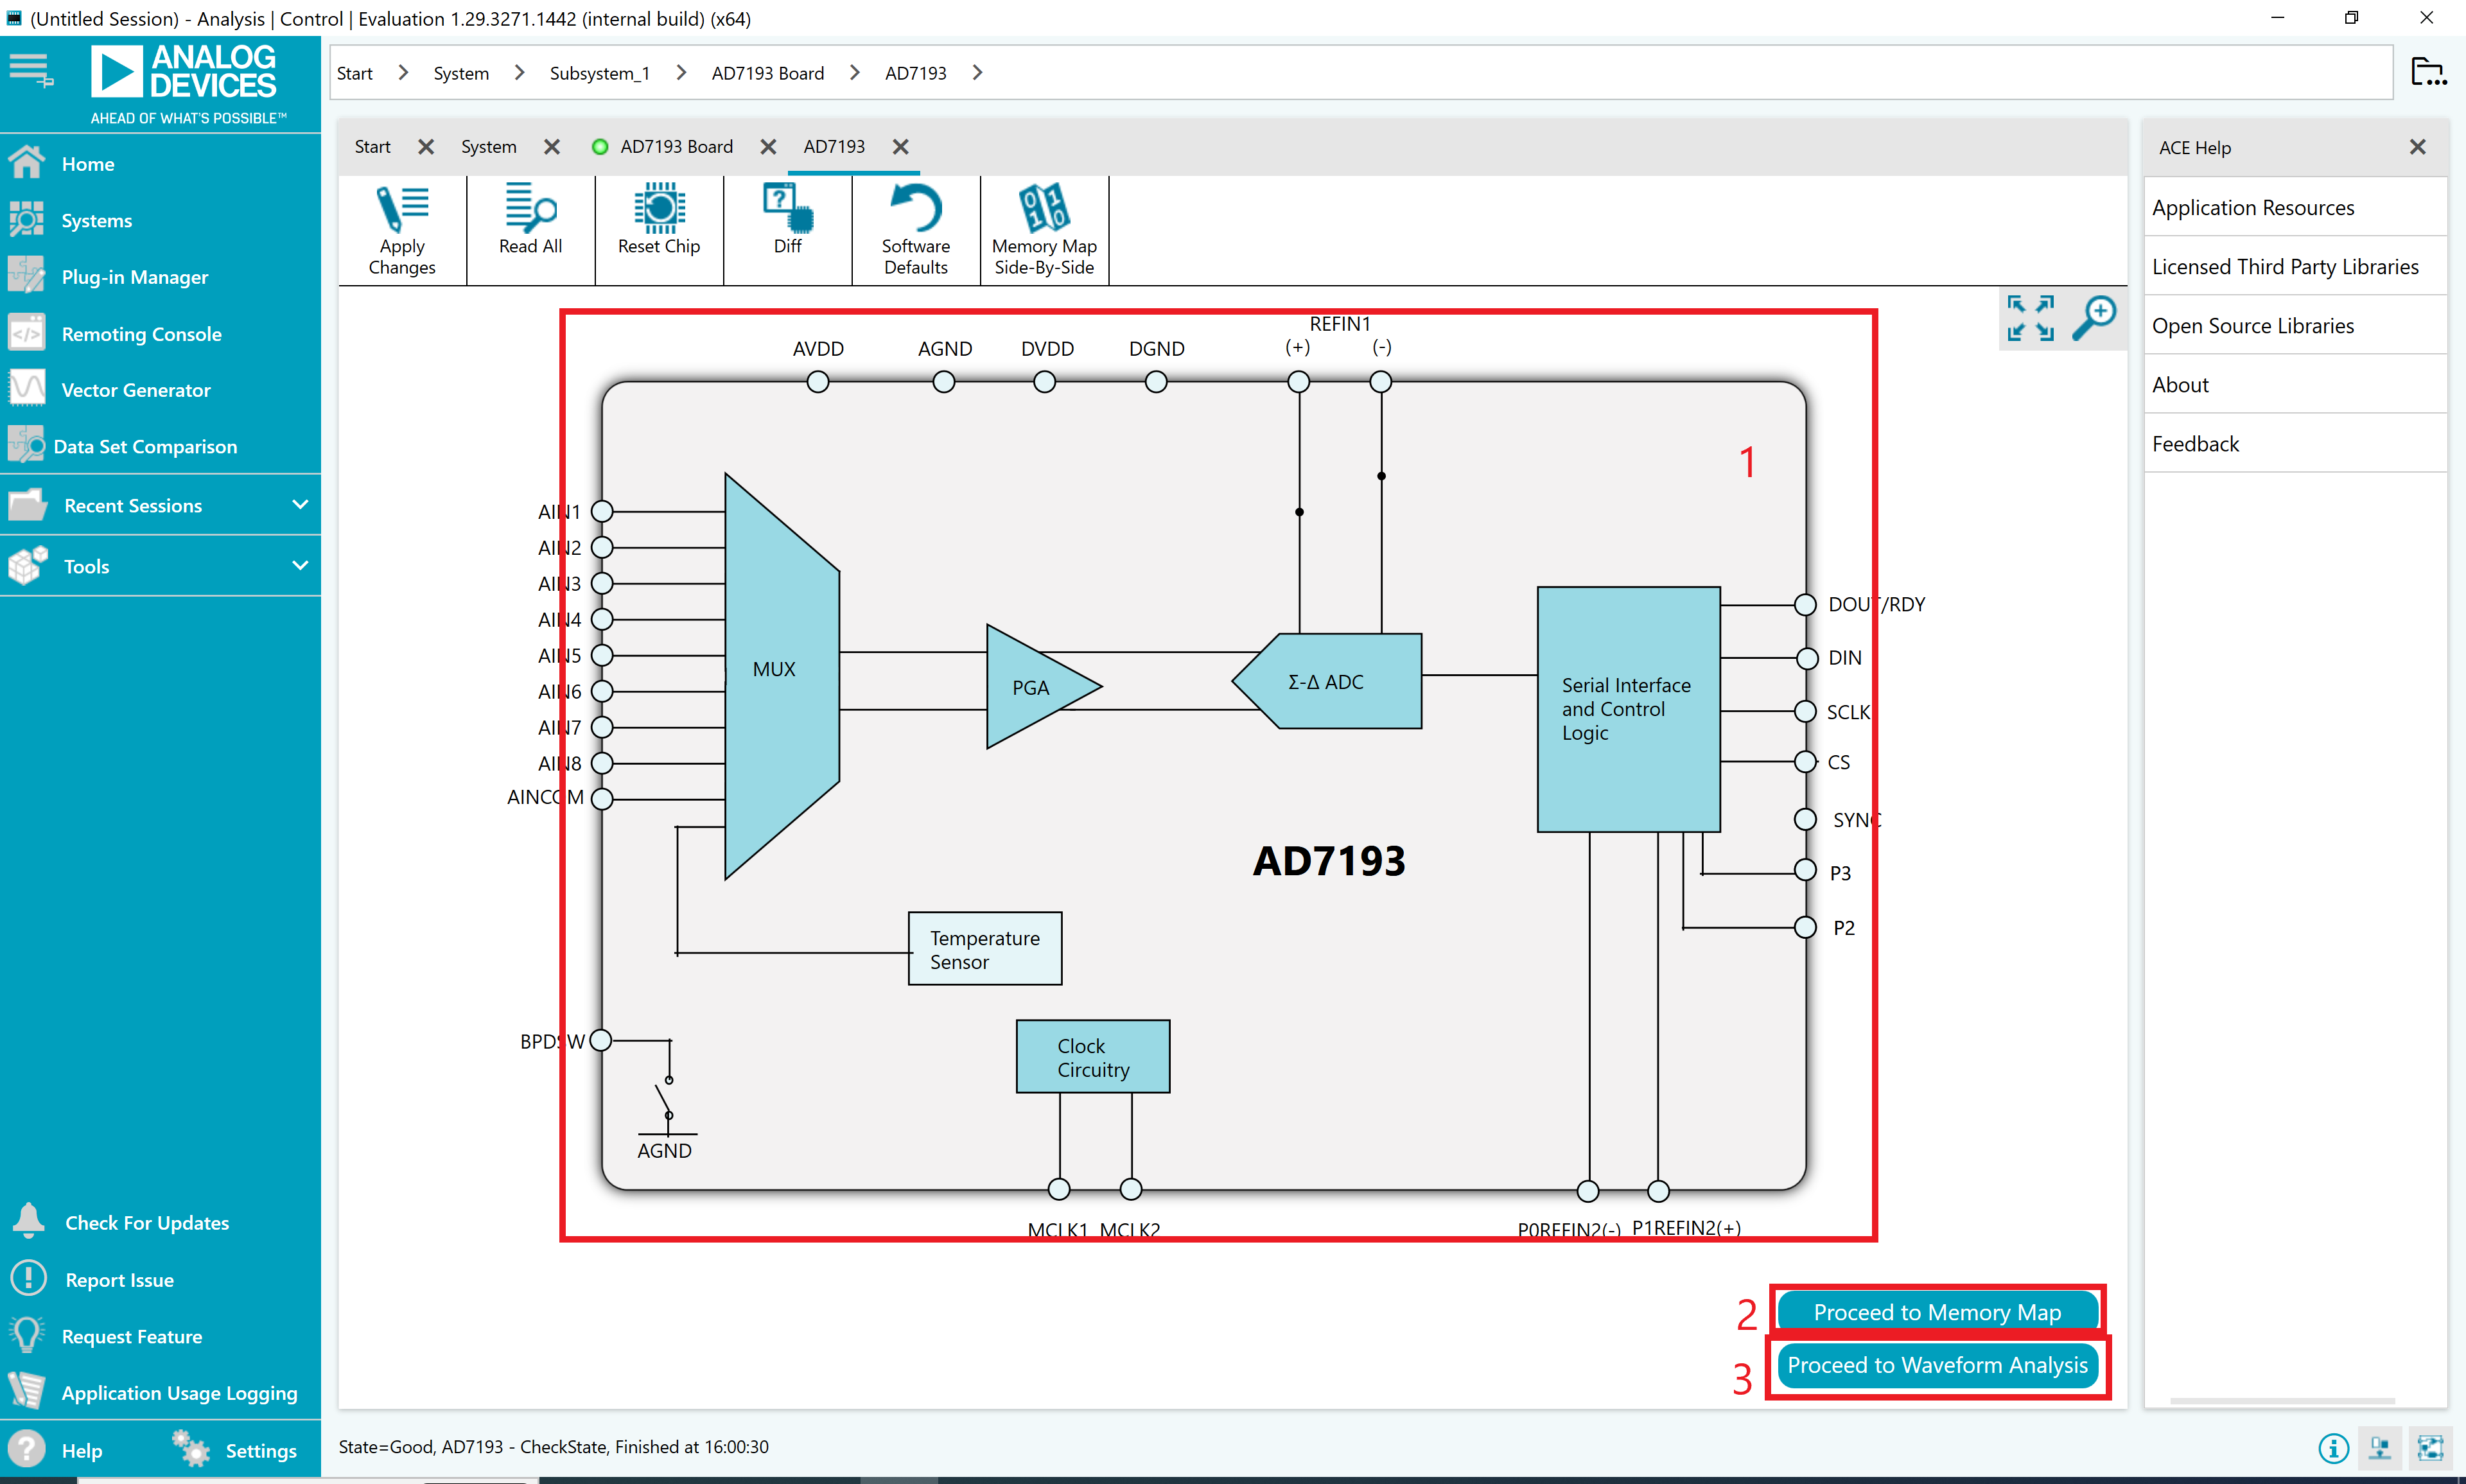
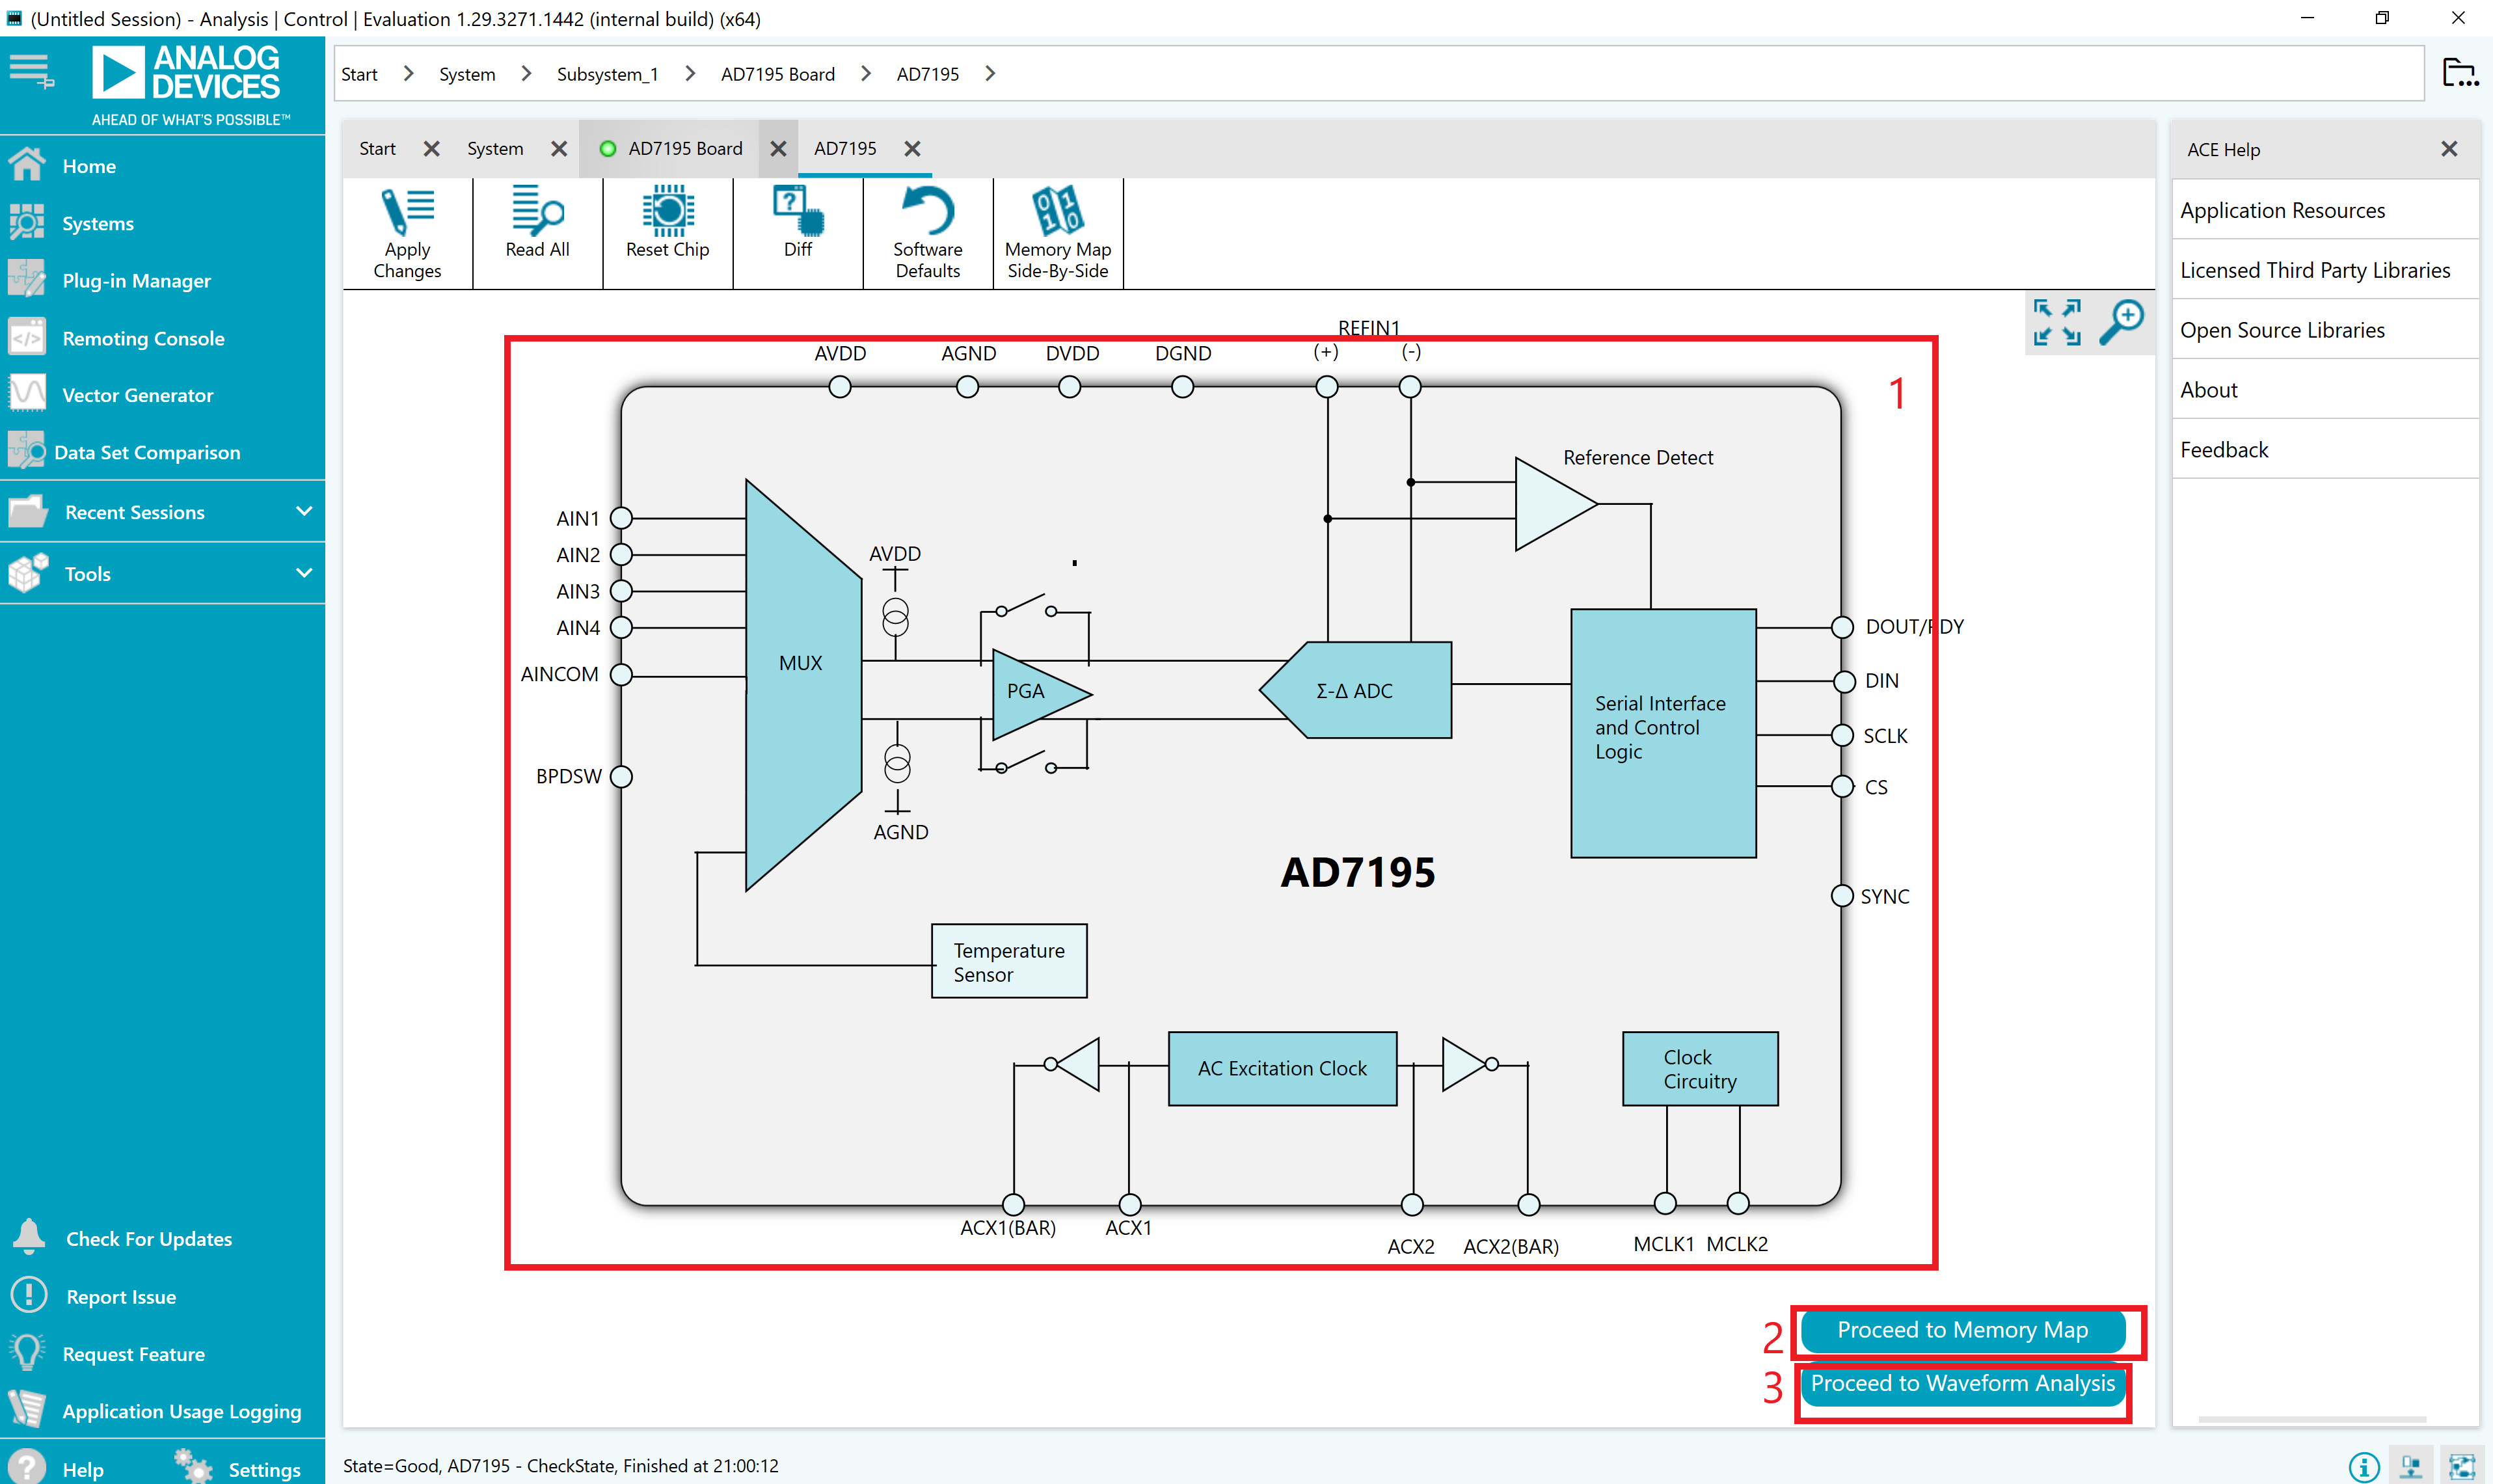
Navigate to the chip view by double-clicking the chip icon.
To make further changes to the configuration, click on the dark blue block in the chip view or double click the memory map option.
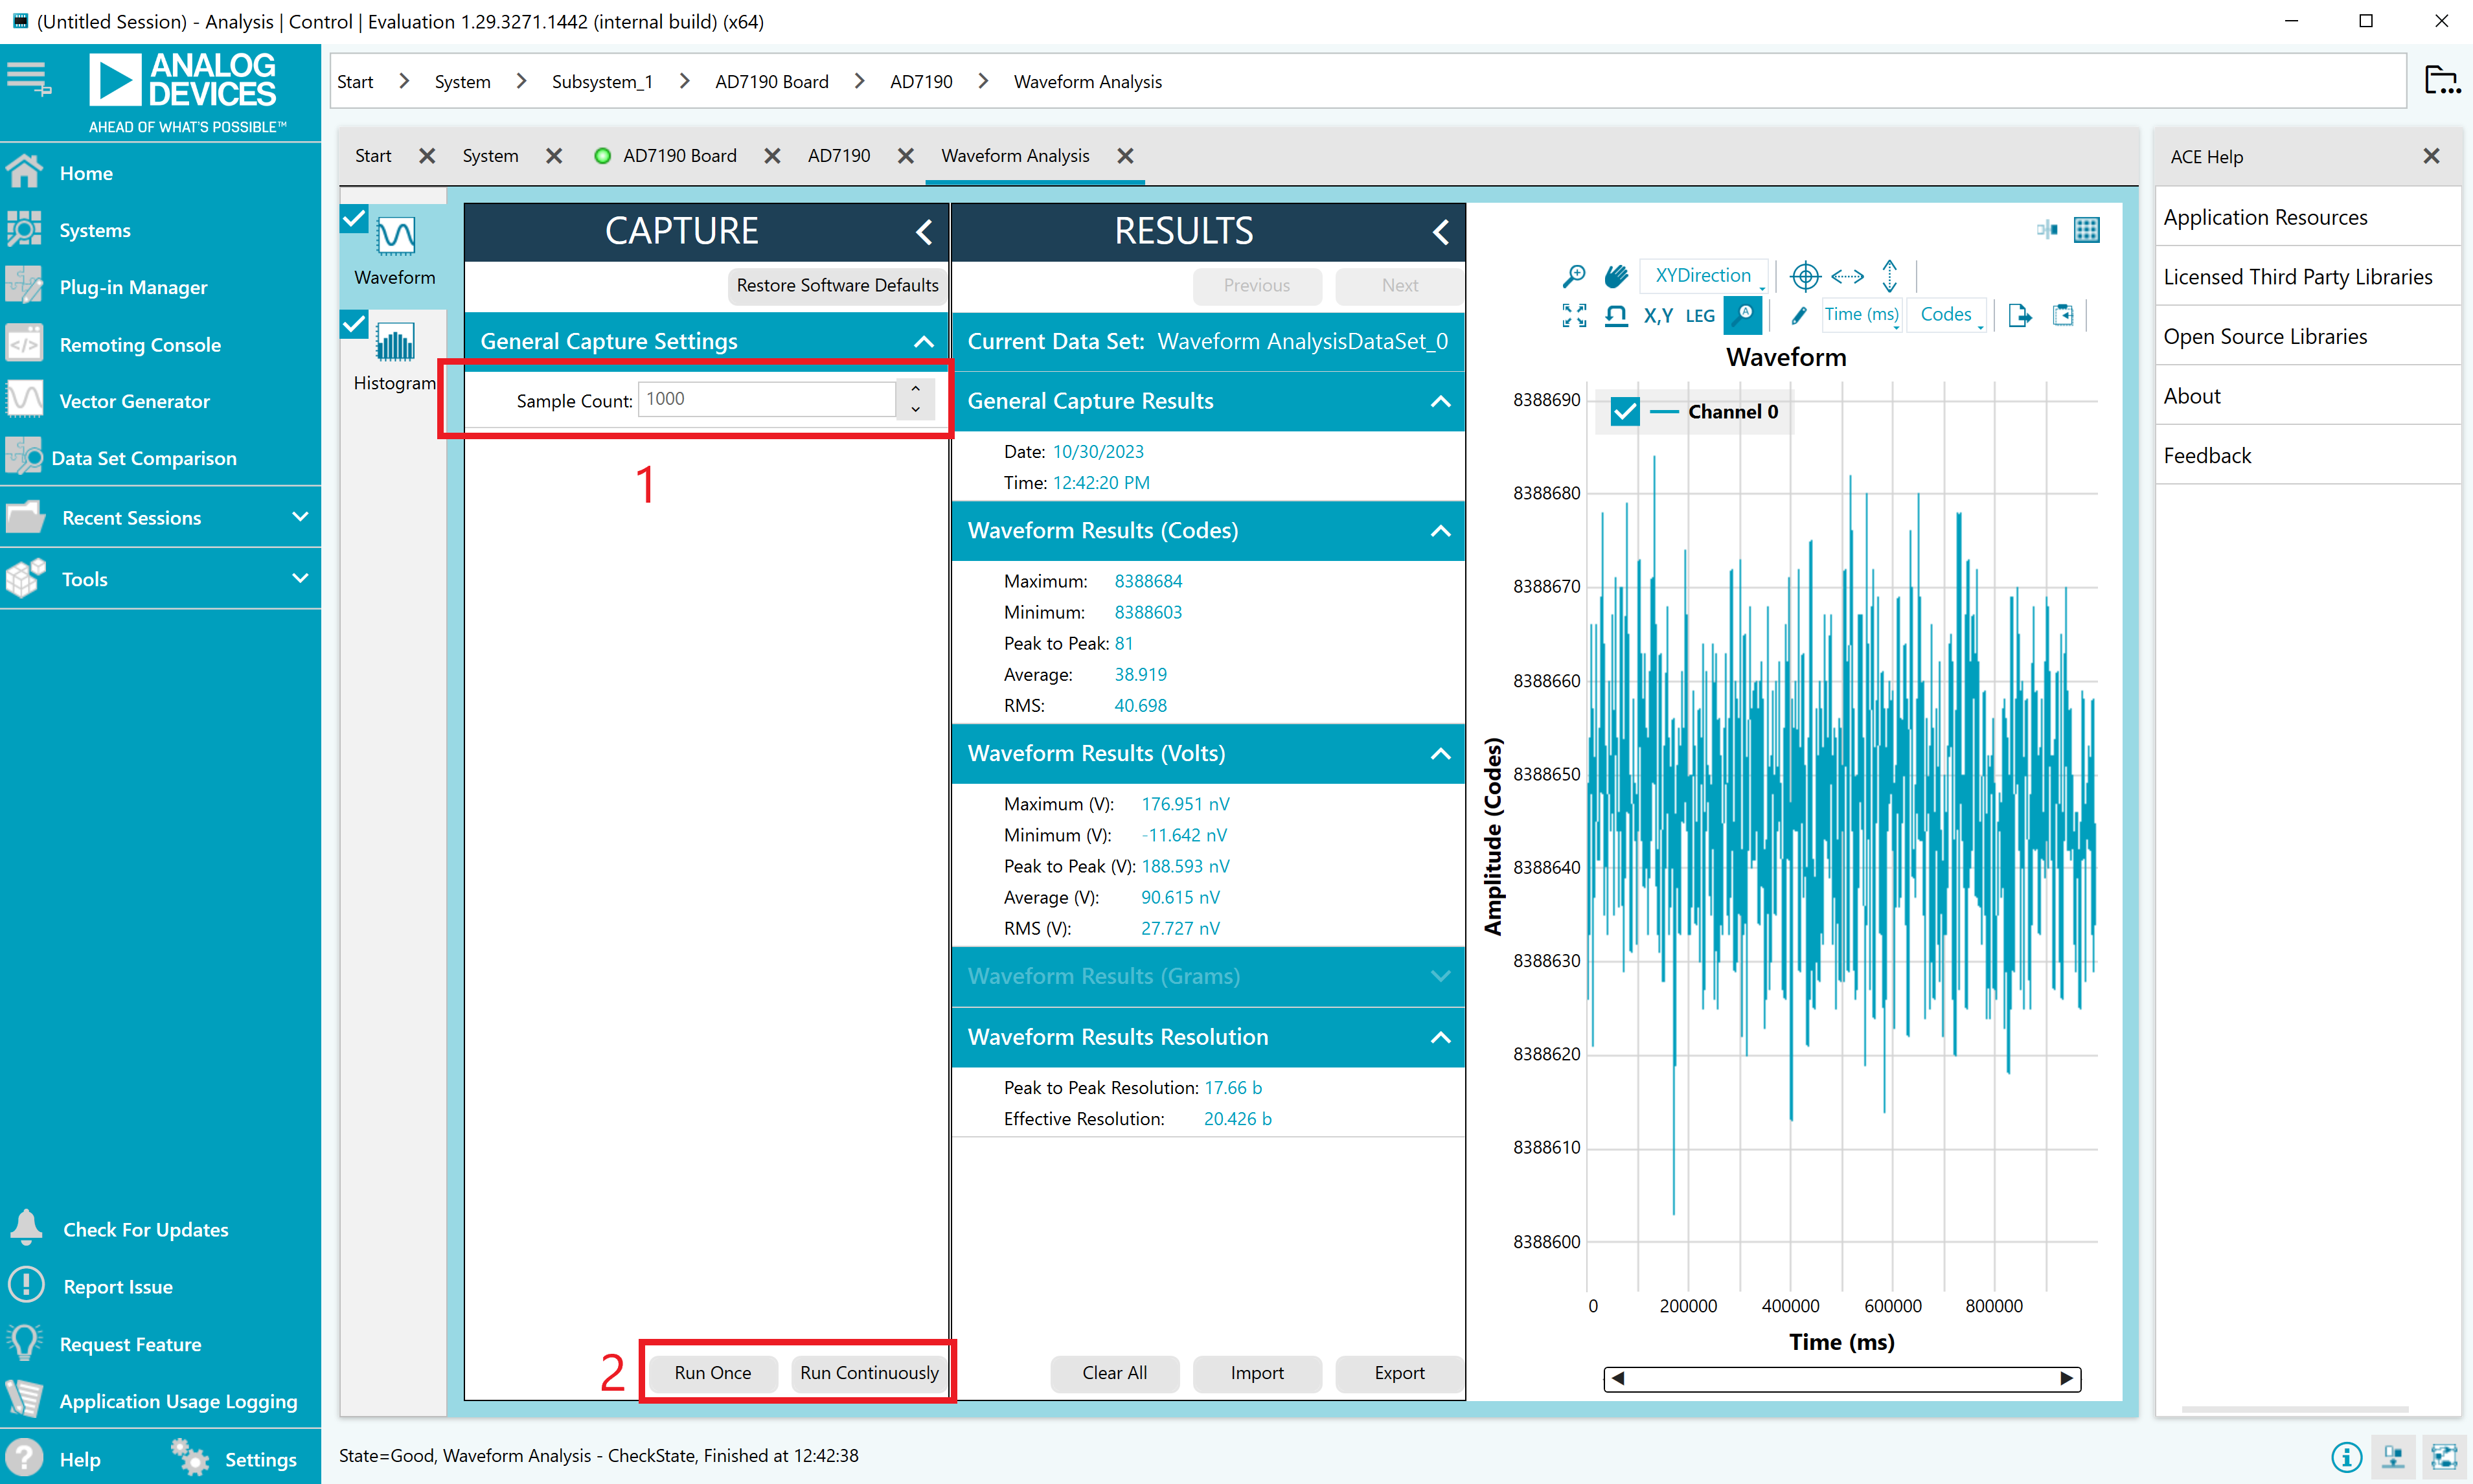
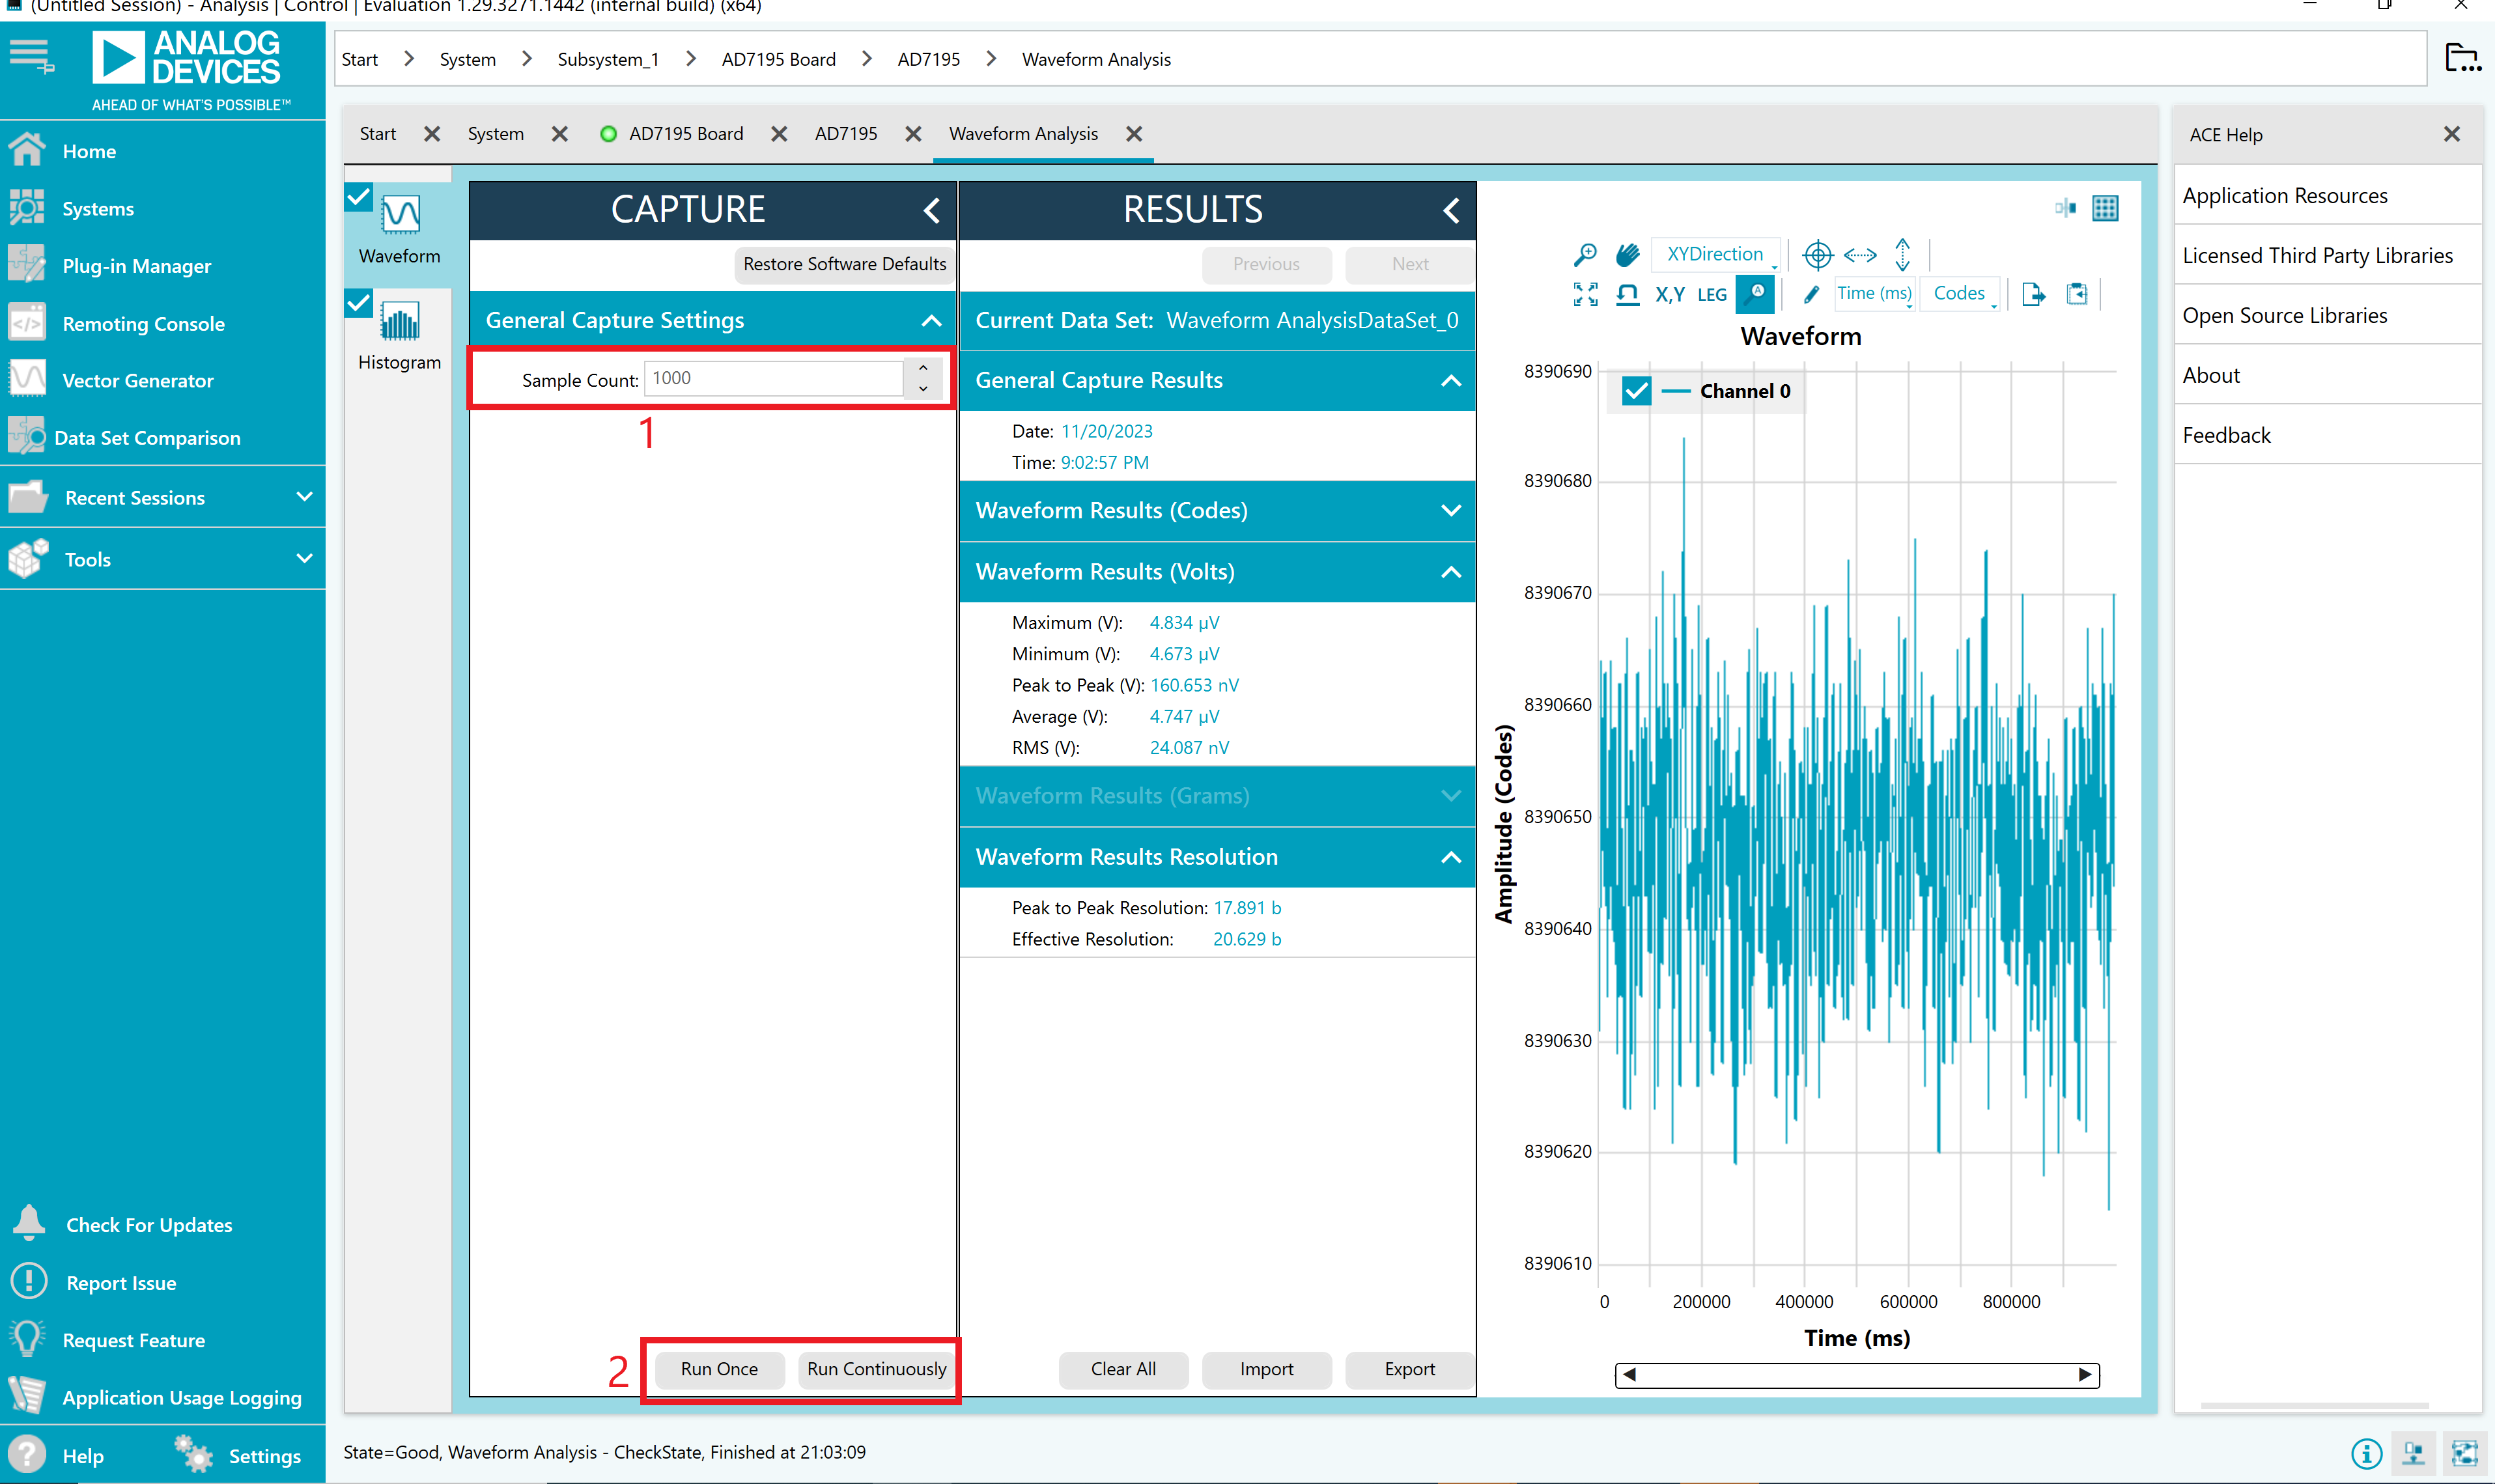
To begin capturing data, double click the Analysis button.
To gather samples, change the Samples Count to the number of samples required, then click Run Once to acquire the samples from the ADC.
Reading Samples from the ADC
The evaluation board is set up to use the external 2.5 V on-board reference (ADR4525). To read samples from the ADC:
The value in the Refin1(+/-) field on the Configuration tab is set to 2.5 V by default to use the external 2.5 V on-board reference (ADR4525). If a different reference is used, the Refin1(+/-) field should be updated accordingly. The analysis results are based on the value set in this input field.
Information on the reference choice can be viewed in the Reference Options section of the hardware guide.
When selecting Run Once, a batch of samples is read when clicking the button; the batch size is set by the value in the Samples field.
When selecting Run Continuous, the software performs a continuous capture from the ADC. Click the Stop Capture button to stop capturing data.
Use the navigation tools within each graph to control the cursor, zooming, and panning.
Viewing Results
Find the waveforms resulting from the gathered samples in the Analysis tab. The waveform graph shows each successive sample of the ADC output (input referred). The indicators beside this graph show the channels converting. The navigation tools allow you to control the cursor, zooming, and panning. You can also display the conversions as voltages or codes. Below the graph are parameters, such as peak-to-peak noise and RMS noise, in the Results section for the current batch of samples. If there are several enabled analog input channels, you can select each enabled channel and the conversions through the analyzed channel using the Results Tab. To save the data into an Excel file, select the Export button from the Results Tab.